About SOI Phases
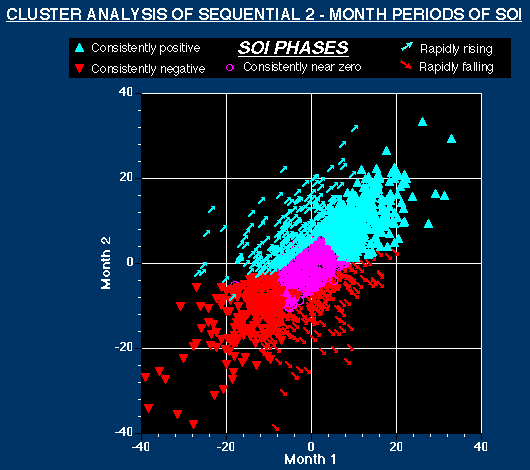
The phases of the SOI were defined by Dr Roger Stone (previously with QDPI), who used cluster analysis to group all sequential two-month pairs of the SOI (from 1882 to 1991) into five clusters (see Figure 1). The phases are:
- Phase 1 consistently negative
- Phase 2 consistently positive
- Phase 3 falling
- Phase 4 rising
- Phase 5 consistently near zero

References
- Stone, R.C., Hammer, G.L and Marcussen, T. (1996) Prediction of global rainfall probabilities using phases of the Southern Oscillation Index. Nature, 384, 252-255.
- Stone, R.C., Hammer, G.L., and Woodruff, D.R (1993) 'Assessment of risk associated with climate prediction in management of wheat in north-eastern Australia' Proceedings 7th Australian Agronomy Conference, Adelaide, September, 1993. Australian Society of Agronomy, Parkville, Victoria, 174-177.
- Stone, R.C., Nicholls, N., and Hammer, G.L. Frost in NE Australia: trends and influences of phases of the Southern Oscillation. Journel of Climate (in press).
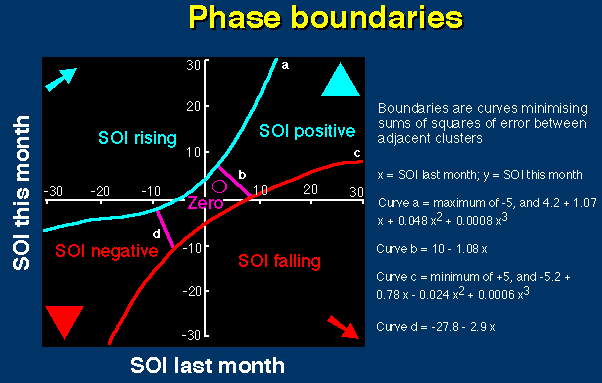
The boundaries between phases (clusters) were defined by Dr Roger Stone then further developed by Dr Jeff Clewett, QDPI, by plotting the distribution of the clusters and mathematically defining the boundary curves to minimise errors (see Figure 2). The curves are also used in AUSTRALIAN RAINMAN; where the SOI phase is calculated over 3- or 4-month periods, average SOI values for the first and last months of the period are used.
SOI Average Vs SOI Phase
Generally use of SOI phases to calculate future seasonal rainfall probabilities gives a more accurate result than using SOI averages.
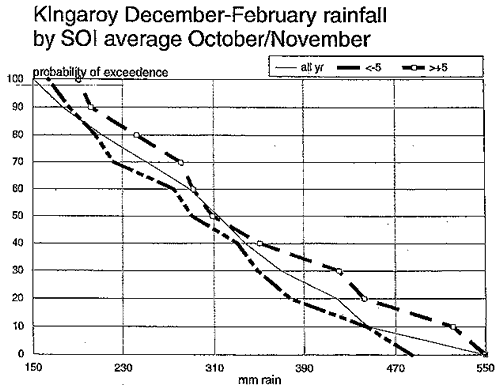
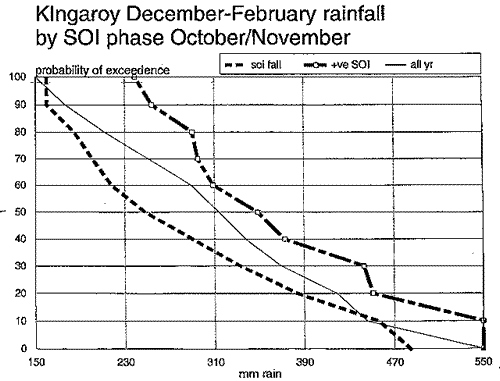
For example, if at the end of November you wanted to determine the probability of receiving at least 310mm at Kingaroy during the December to February period:
using the SOI average during October-November, the probabilities can range from about 45% to 52% (see Figure 3); and
using the SOI phase during the October to November period, the probabilities can range from about 35% to 60%.(see Figure 4).
Thus, the increased accuracy of rainfall probabilities derived from the SOI phase may significantly improve weather-related decisions.
Reference: AUSTRALIAN RAINMAN Version 2.1 Users Guide.
Data sourced from Queensland Department of Primary Industries and Fisheries.


