Queensland's climate is highly variable, but climate change is leading to shifts beyond this natural variability. Average temperatures across the state are already more than 1.5 °C higher than there were prior to the industrial revolution. There has been a clear warming trend in recent decades.
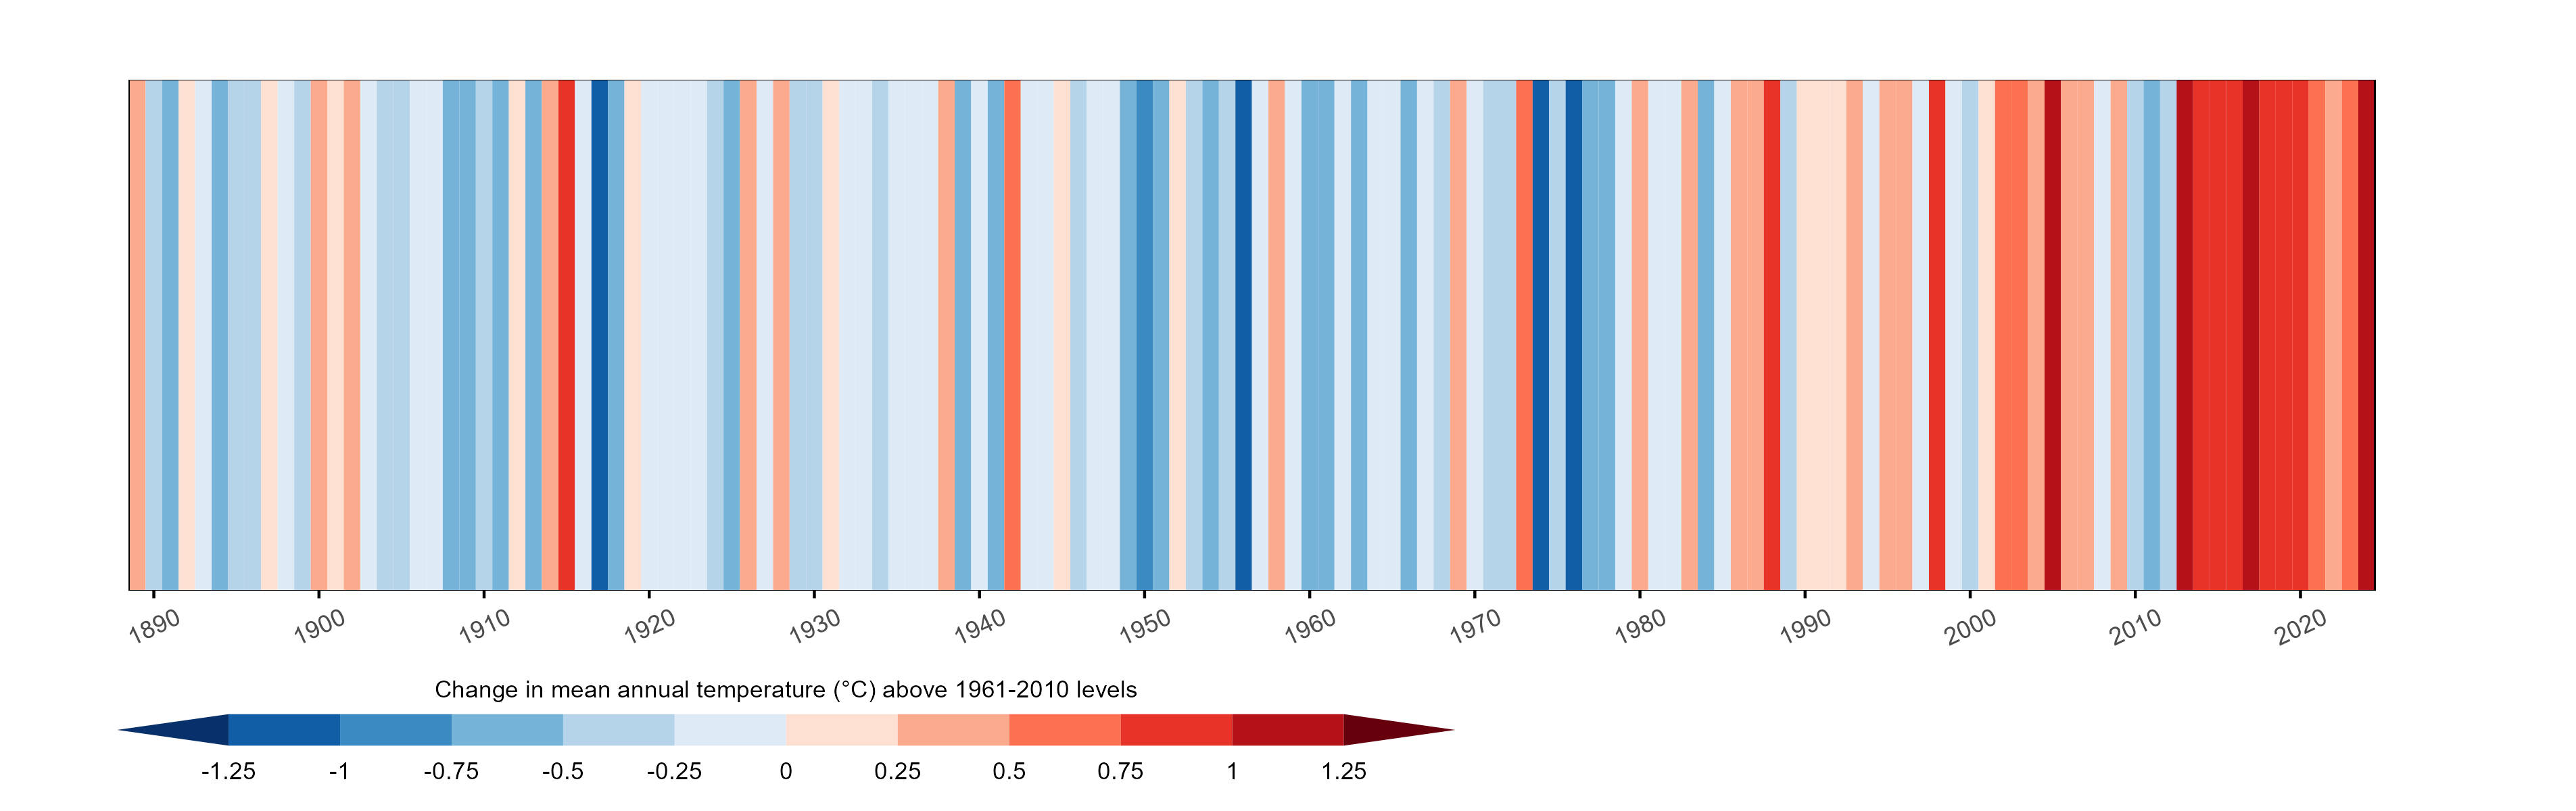
Change in Queensland's mean annual temperatures displayed using the climate stripe visualisation method developed by Professor Ed Hawkins. Click here to view the Queensland Climate Stripes and projections.
The climate is changing primarily because increasing amounts of greenhouse gases in the atmosphere are trapping heat, and warming the air and oceans.
Climate change is likely to bring changes such as more extreme heat events, harsher fire weather and heavy rainfall events in some places. There may be some advantages too, such as fewer frosts. To prepare, we need to understand how climate is likely to change, region by region.
The Queensland Government has produced extensive high-quality material describing likely future climatic changes based on the latest national and international climate science.
The Queensland Future Climate Dashboard presents the latest climate projections for the state via a map-based interface that enables users to explore climate projection information for regions and specific locations (such as cities and towns).
Climate models are useful tools to investigate and understand past, current and possible future climates. Global climate models simulate the Earth's climate system and the key processes that influence climate using the laws of physics. The models run on powerful computers and represent fundamental physical processes in the land, atmosphere, oceans and ice.
The world’s latest climate models
Scientists have developed a range of global climate models (GCMs) to understand how climate will change in the future. The models are constantly updated as modelling groups incorporate higher spatial resolution (i.e. smaller model grid cells) and new physical processes and chemical cycles as our understanding of these processes improves.
The World Climate Research Programme (WCRP) coordinates an international collaborative climate modelling project that compiles and makes available international simulations of future climate. Since 1995, the Coupled Model Intercomparison Project (CMIP6) has regularly provided new global climate projection datasets. The sixth and latest phase, CMIP6, includes more than 100 climate models from 49 different climate research institutions.
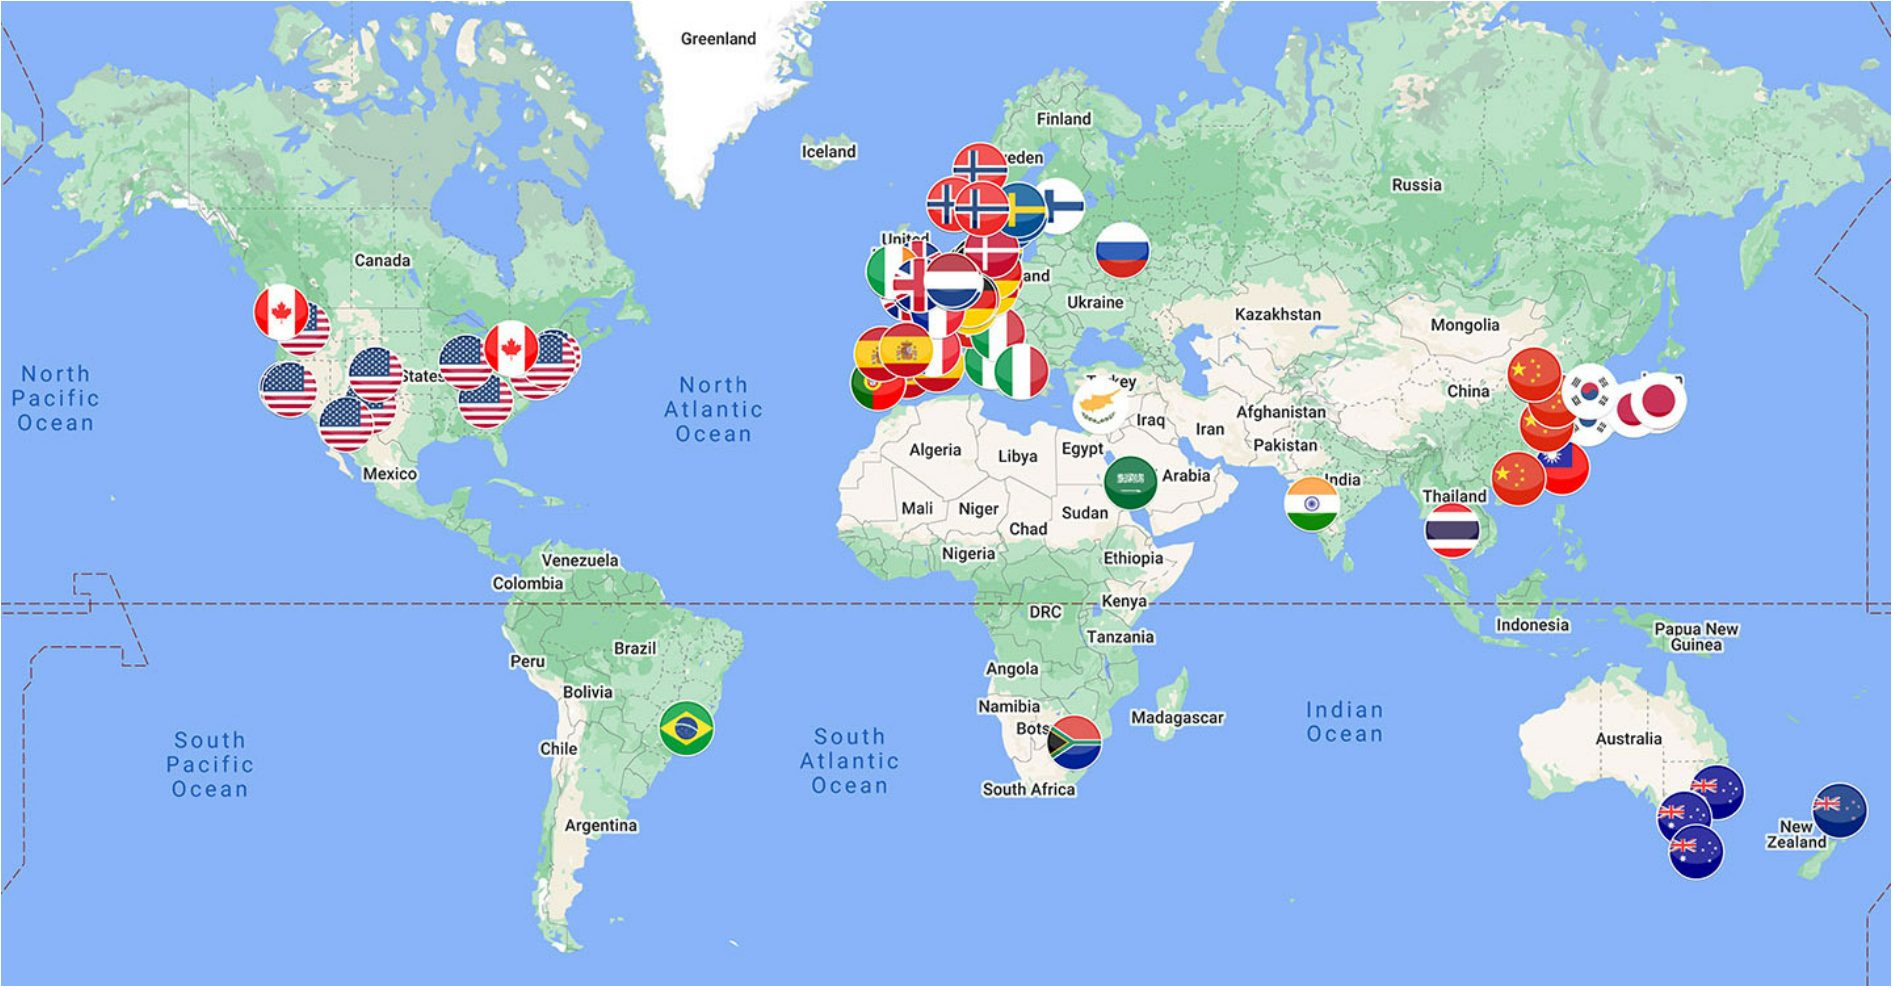
Nations whose climate modelling groups submitted global models to the Coupled Model Intercomparison Project Phase 6 (CMIP6). Source: NASA 2021
While the CMIP project is for global models, the Coordinated Regional Downscaling Experiment (CORDEX) is a collaborative effort focussed on regional climate modelling. CORDEX evaluates how well climate models produce regional climate change projections and provides guidelines on how the models can be used to produce regional climate projection datasets in a consistent way.
The Queensland Government is part of the National Partnership for Climate Projections that is guiding a collaborative and integrated approach to delivering Australian climate projection science and projections information. The objectives of this partnership are described in the Climate Projections Roadmap for Australia. The Queensland Government, along with other Australian modelling groups, are contributing models for CORDEX Australasia.
High-resolution climate simulations
GCMs are essential for investigating climate change, but their coarse spatial scale limits their value for regional climate adaptation planning. Typically, CMIP6 models employ horizontal grids at the Earth’s surface that range from 100 km to 250 km in size. As a result, these GCMs will project the same climate for any place within a large grid cell without reference to local conditions, such as proximity to the coast or mountains.
Queensland Government researchers have evaluated the way in which global climate models simulate the state’s precipitation, temperature and sea surface temperature, selecting the best-performing models to assess likely future changes.
Finer spatial resolution is important for simulating climate effects of local-scale factors, such as the coastline, mountain ranges and other local topographic features. The Queensland Future Climate Science Program uses a technique known as ‘dynamical downscaling’ to produce finer resolution and more detailed climate information to support local hazard assessments and decision-making. Dynamical downscaling uses a high resolution regional climate model (RCM) over a limited area with initial boundary conditions taken from a GCM. The most important forcing inherited from GCMs during Queensland Future Climate's downscaling approach are sea-surface temperatures, which have been adjusted to match the observed climate.
The Queensland Future Climate Science Program used the Conformal Cubic Atmospheric Model (CCAM) developed by CSIRO as the regional model for the downscaling process. CCAM achieves high detail in selected areas via a variable resolution and global cubic grid design.
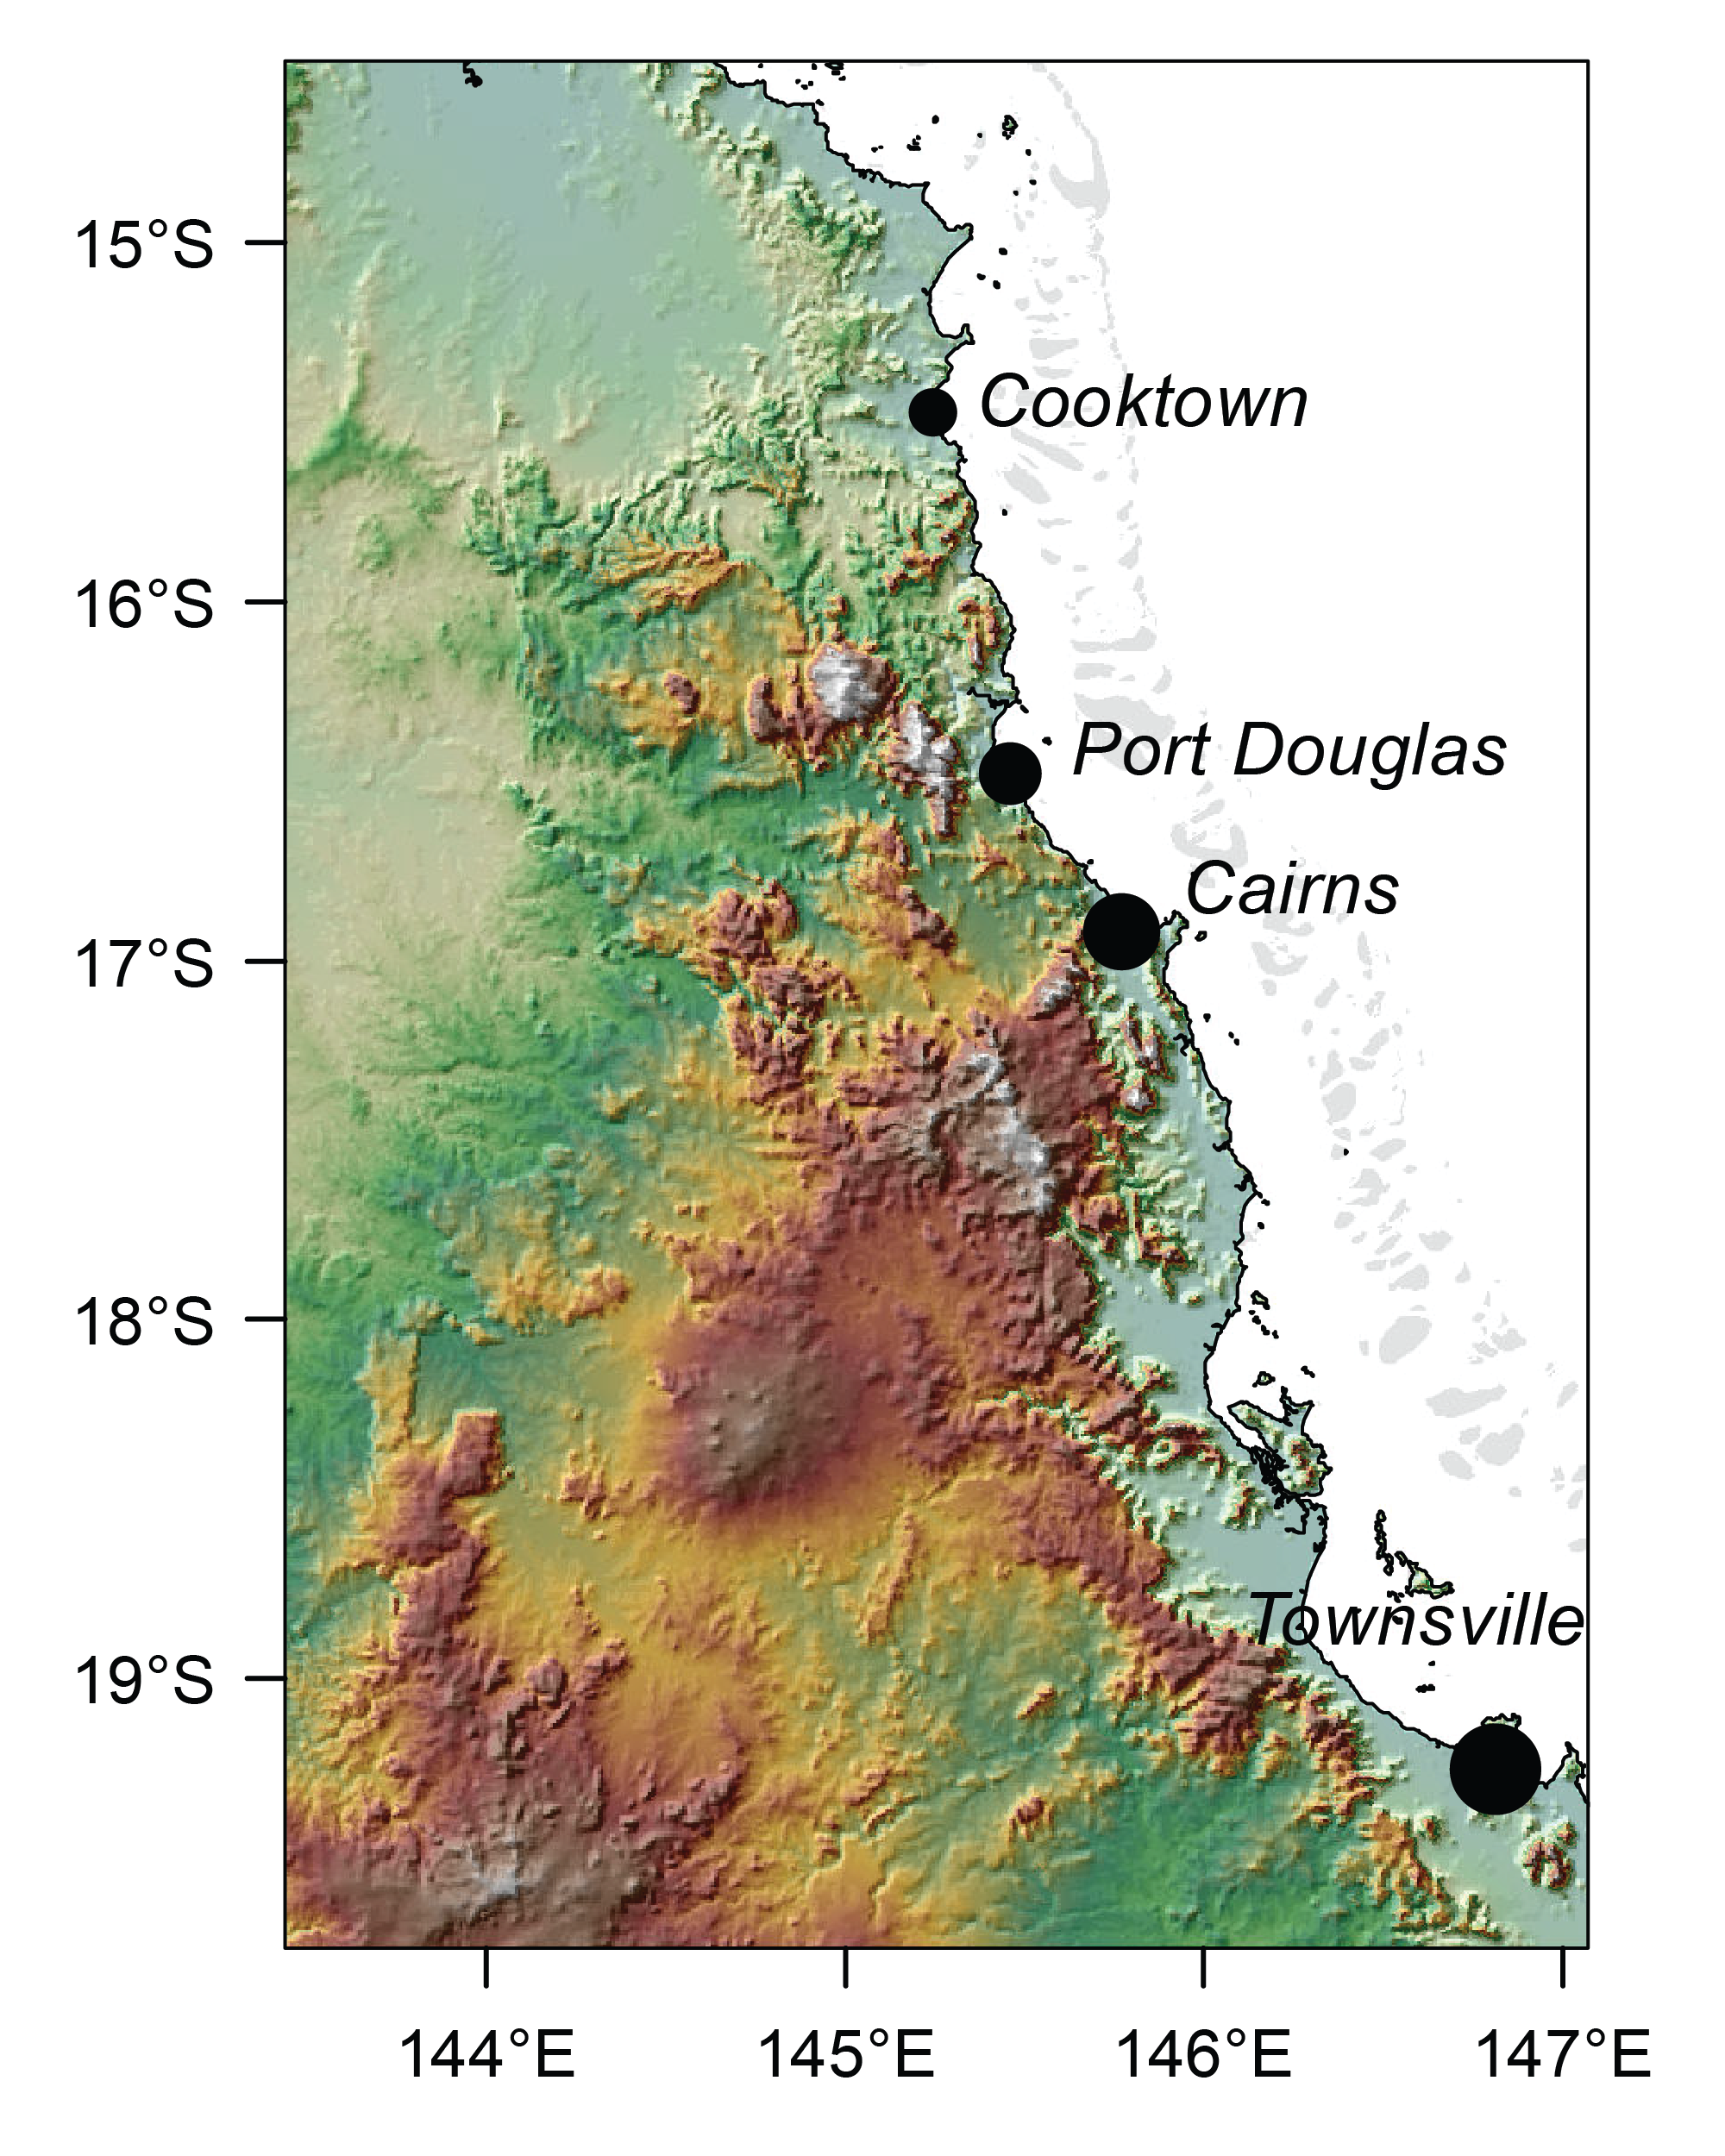
A common factor affecting the usefulness of global climate models (GCMs) for predicting regional climate conditions is their resolution. This case study, featuring Cairns and surrounding areas, illustrates the benefit of dynamically downscaling GCMs in regions where regional-scale features, such as topography, have a substantial impact on the regional climate.
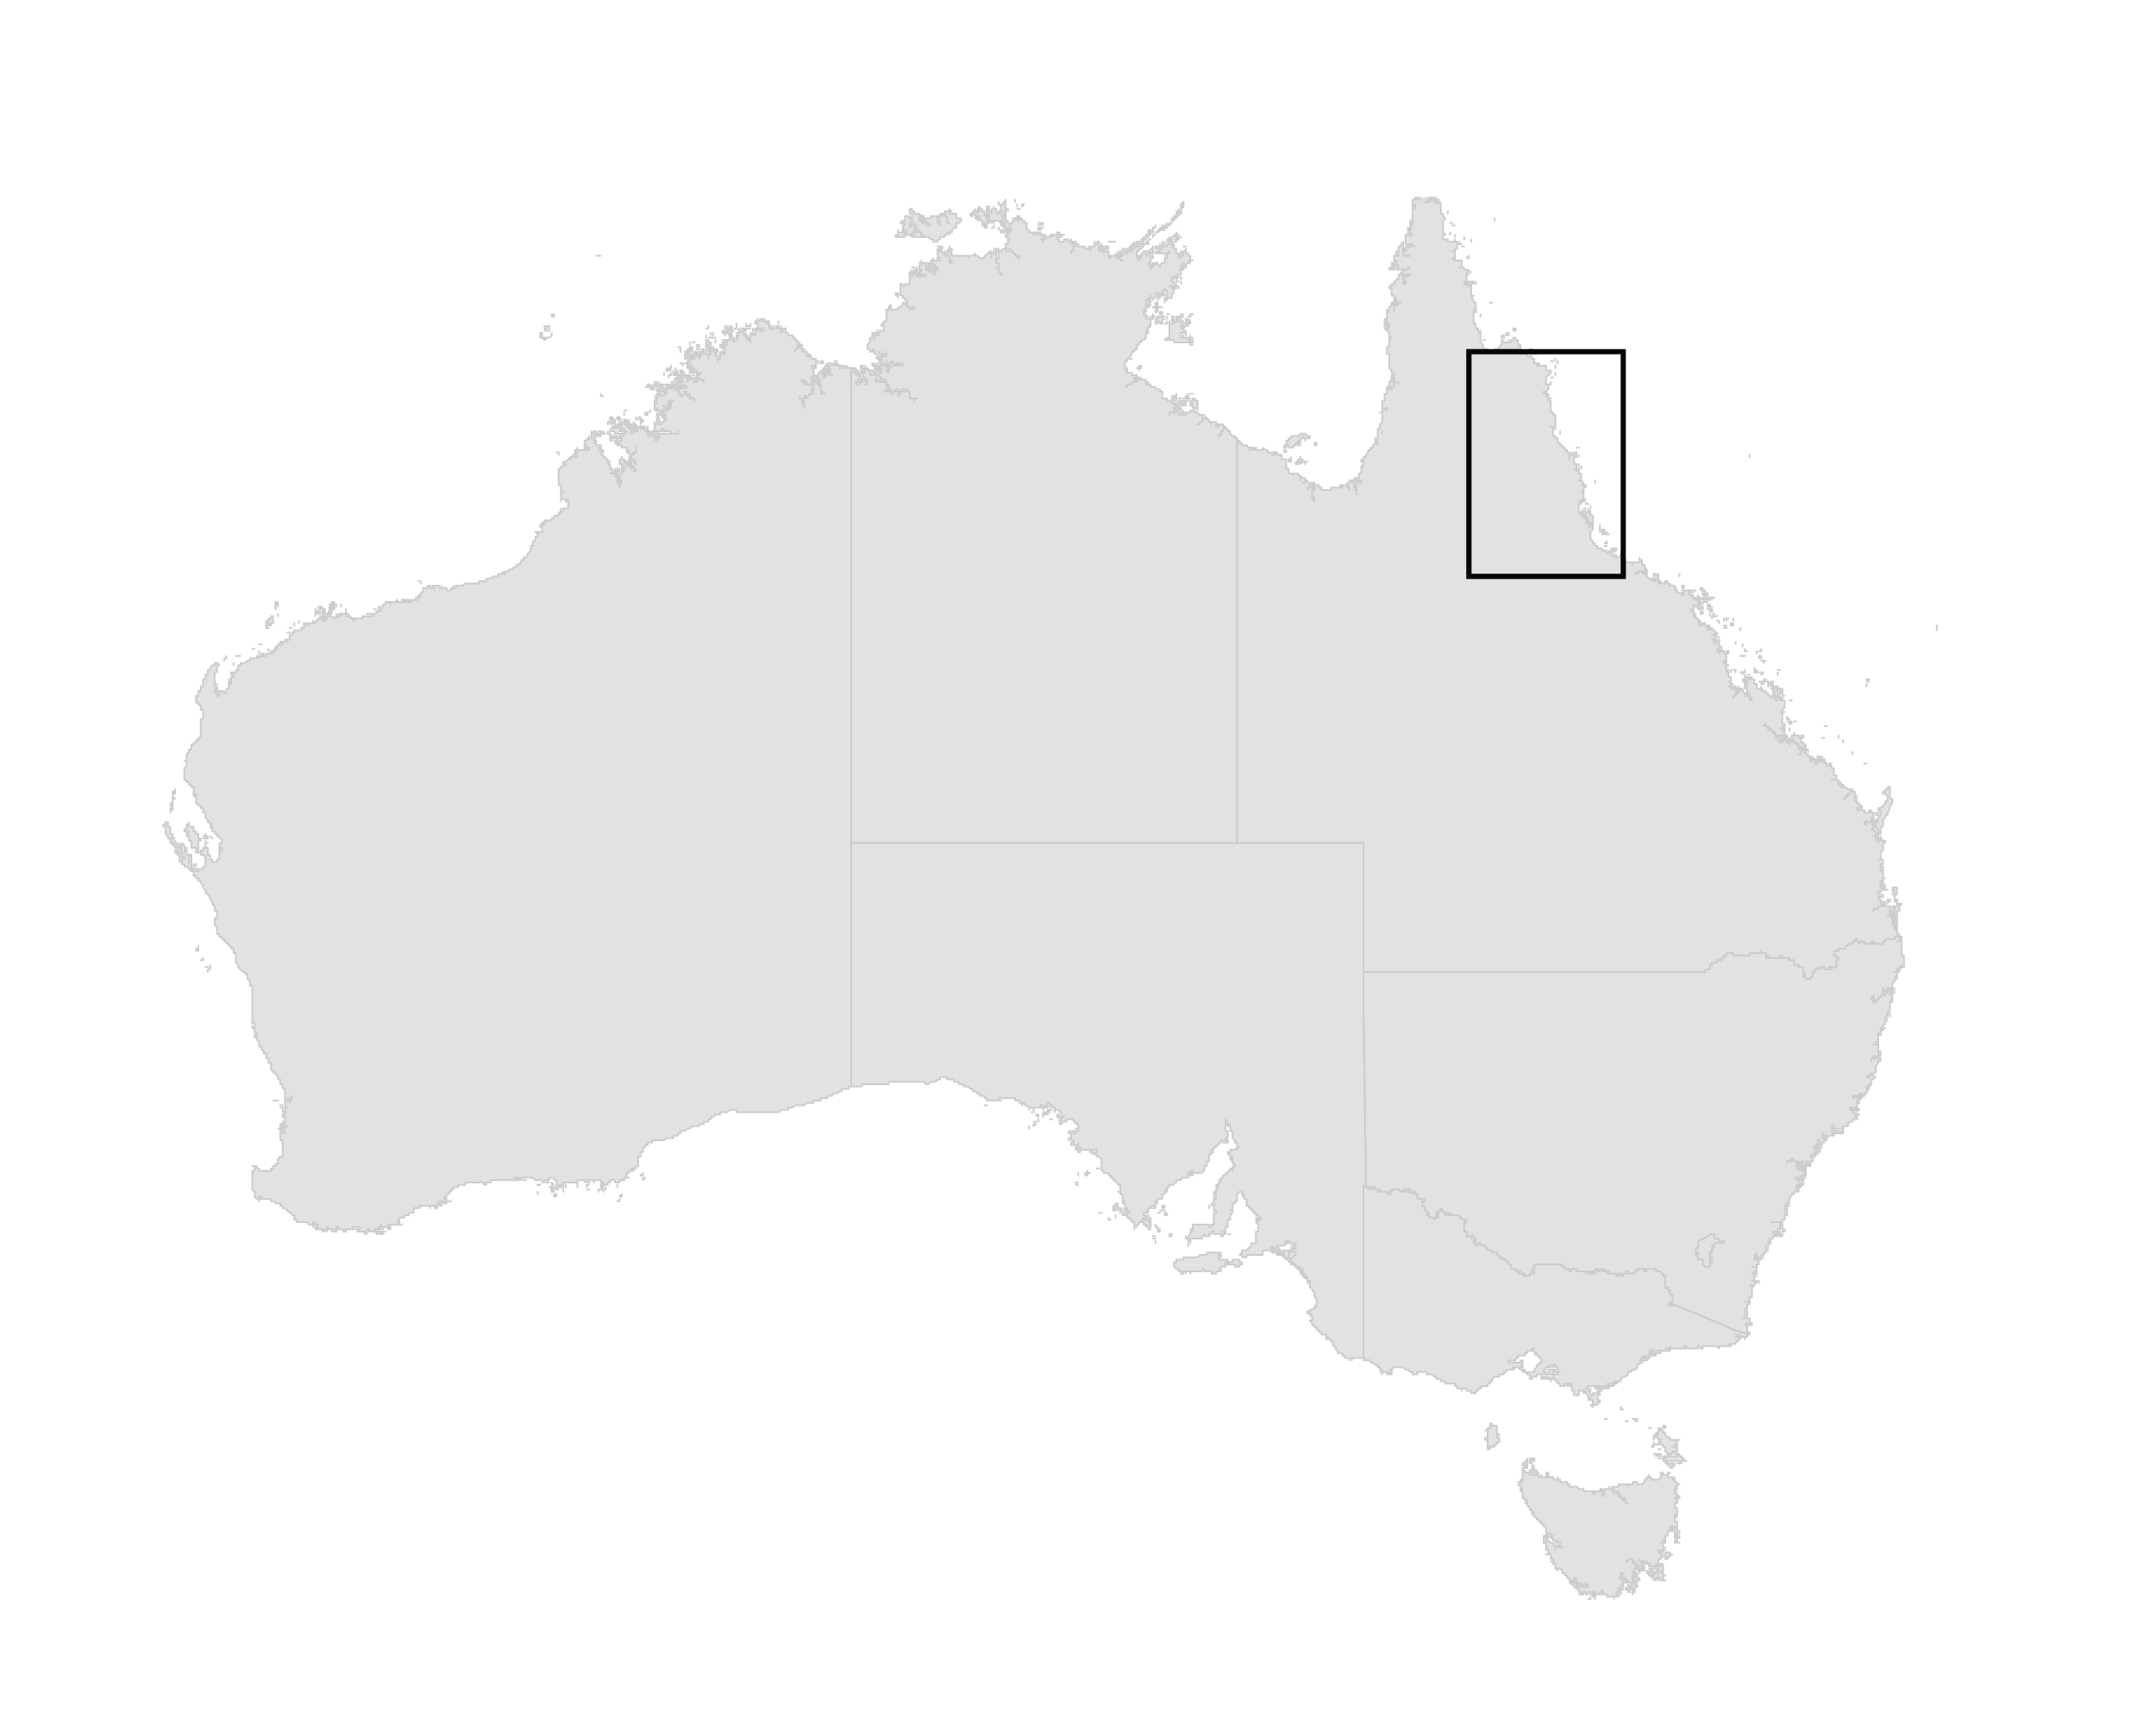
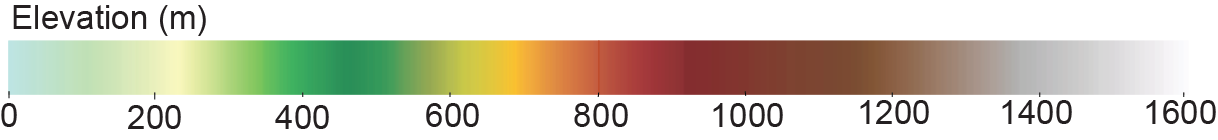
The Cairns region features diverse topography, from near-sea-level plains to mountainous terrain exceeding 1500 m in elevation, as depicted by high resolution radar observations (left-hand image below). Due to their coarse spatial resolution, GCMs attribute the same topography to a large extent, ignoring regional features. The significantly higher spatial resolution of regional climate models, such as CCAM, allows them to more accurately represent regional-scale topography (right-hand image).
Use the slide bar on the right-hand image to view the superior resolution of topography used in regional climate models compared to GCMs.
Observational Data
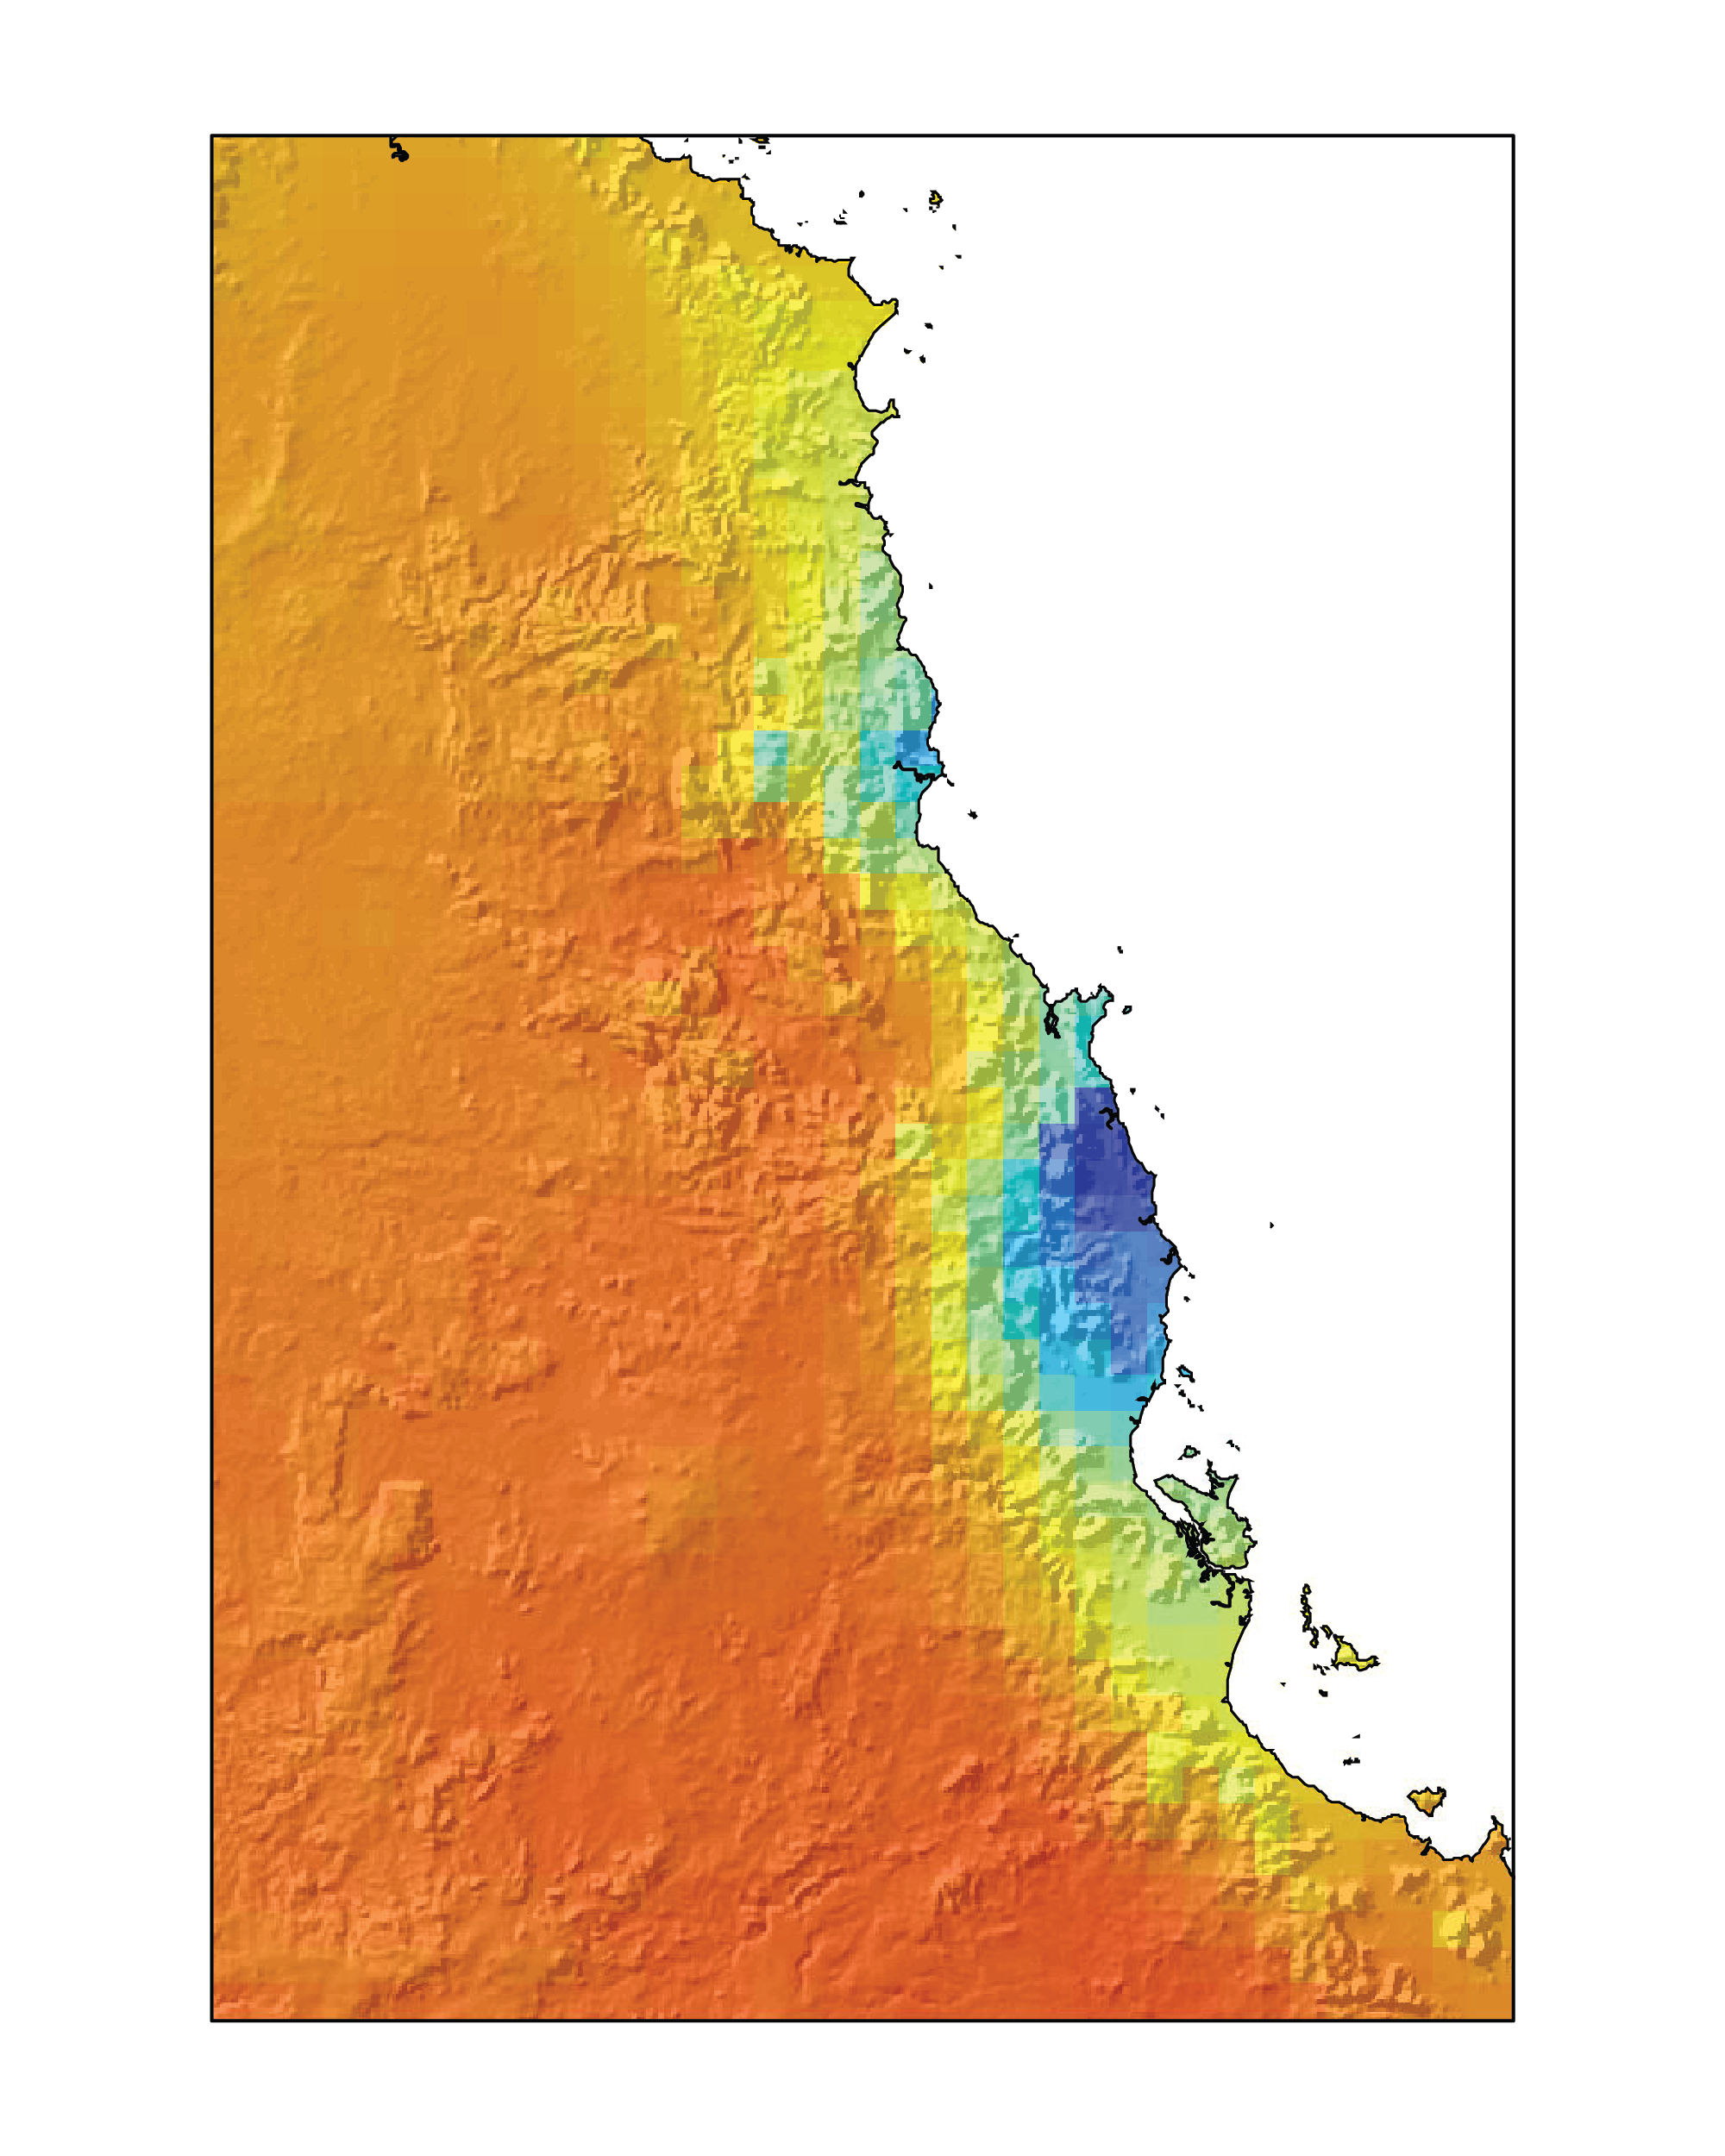
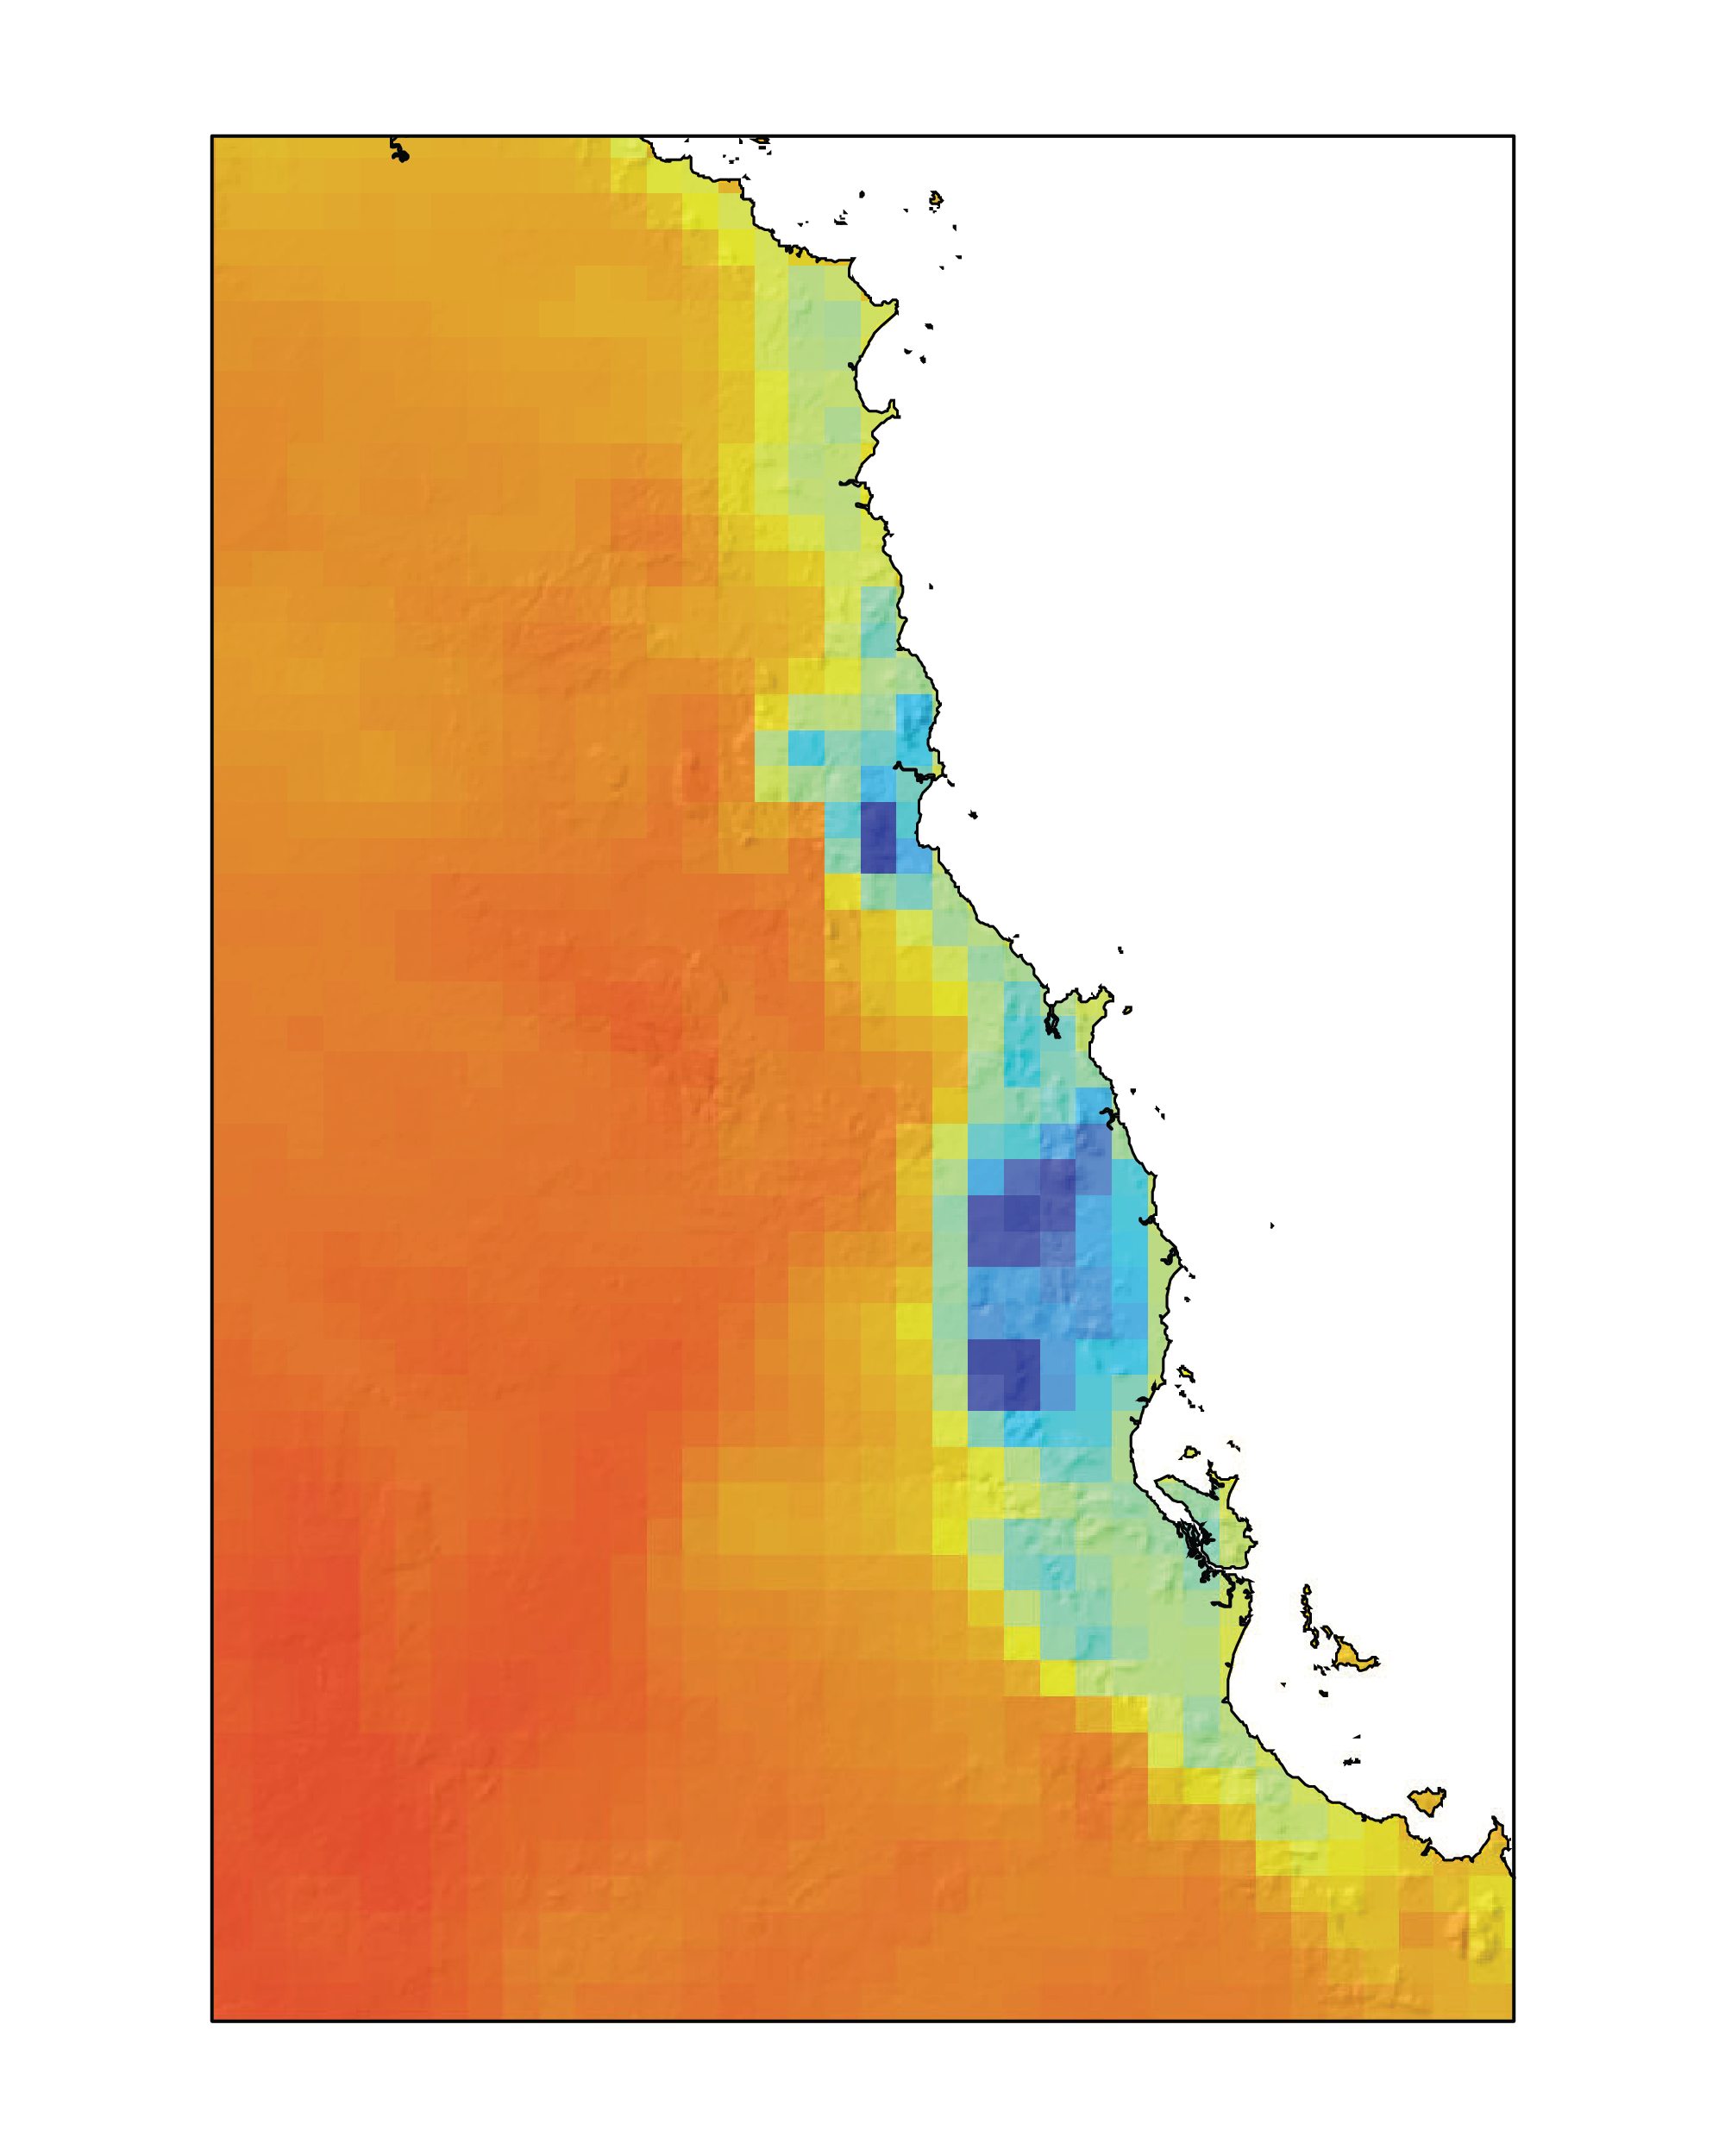
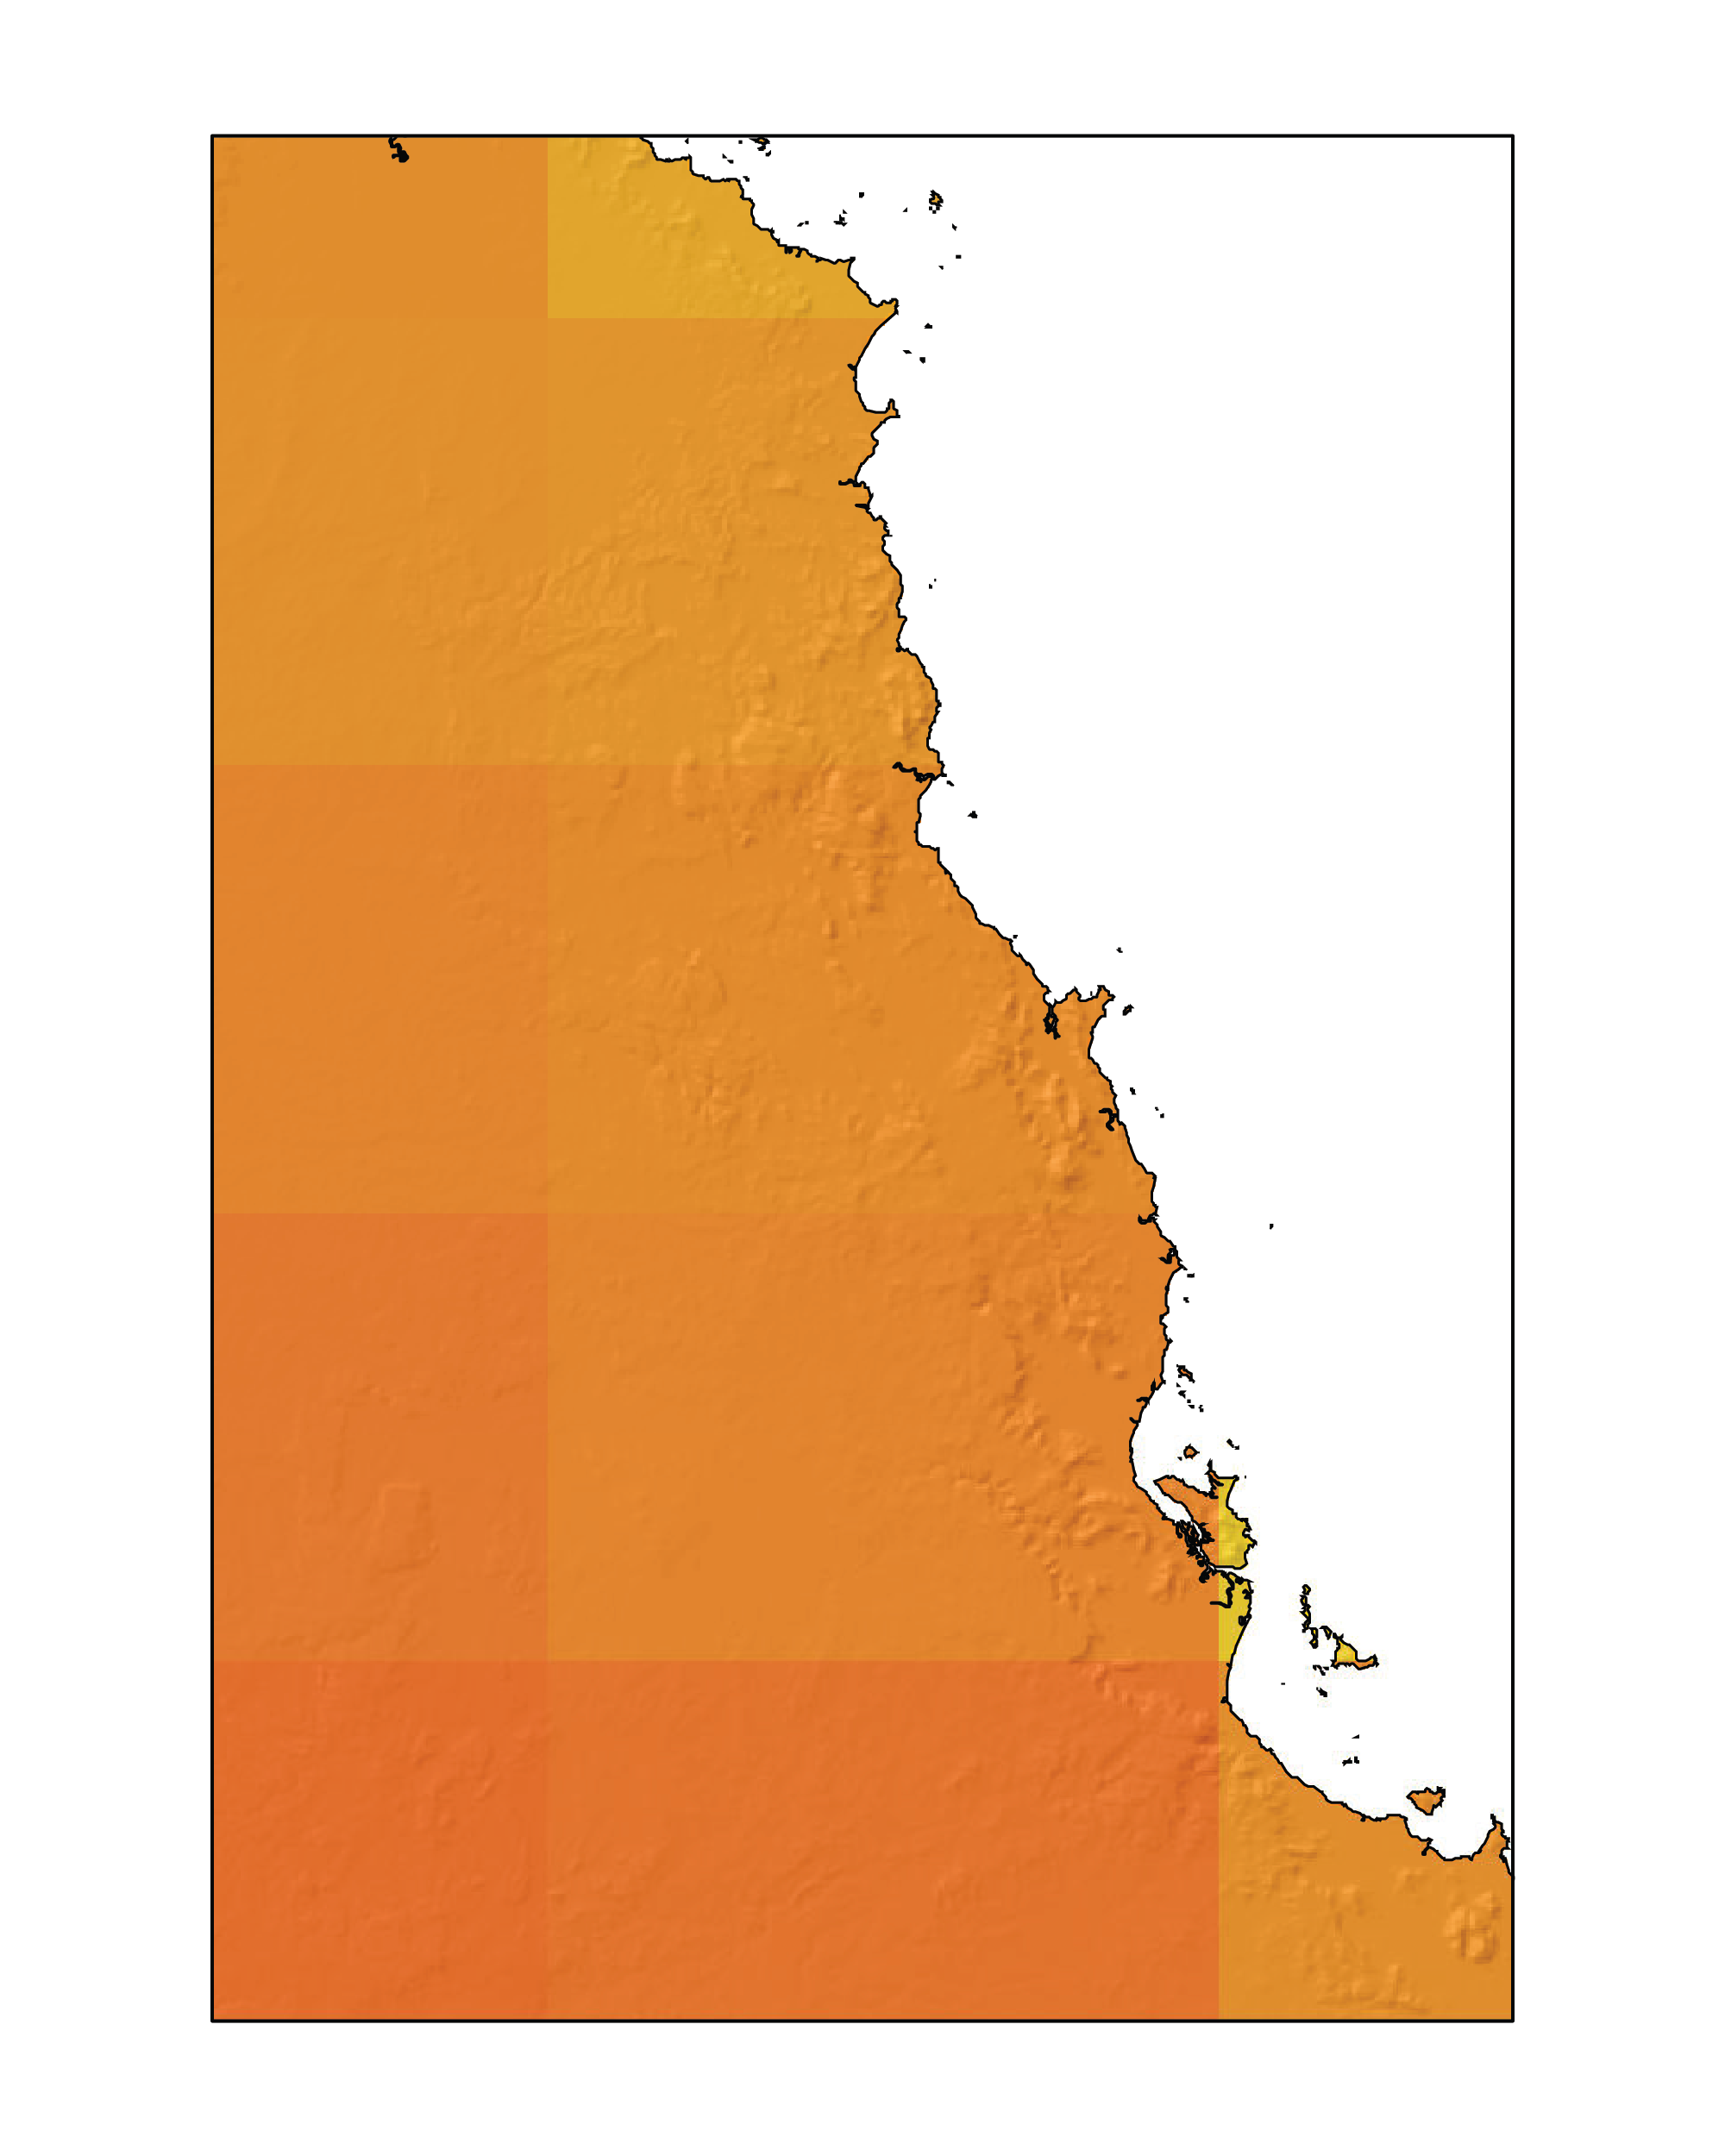
The elevated topography around Cairns significantly influences precipitation patterns, with orographic lifting on the eastern slopes of the mountain ranges producing a distinct spatial gradient in rainfall observations (left-hand image). Downscaled climate projections more accurately capture this effect compared to the coarse GCM output (right-hand image).
Use the slide bar on the right-hand image to view how downscaled climate projections more accurately capture the effect of topography on precipitation.
Observational Data
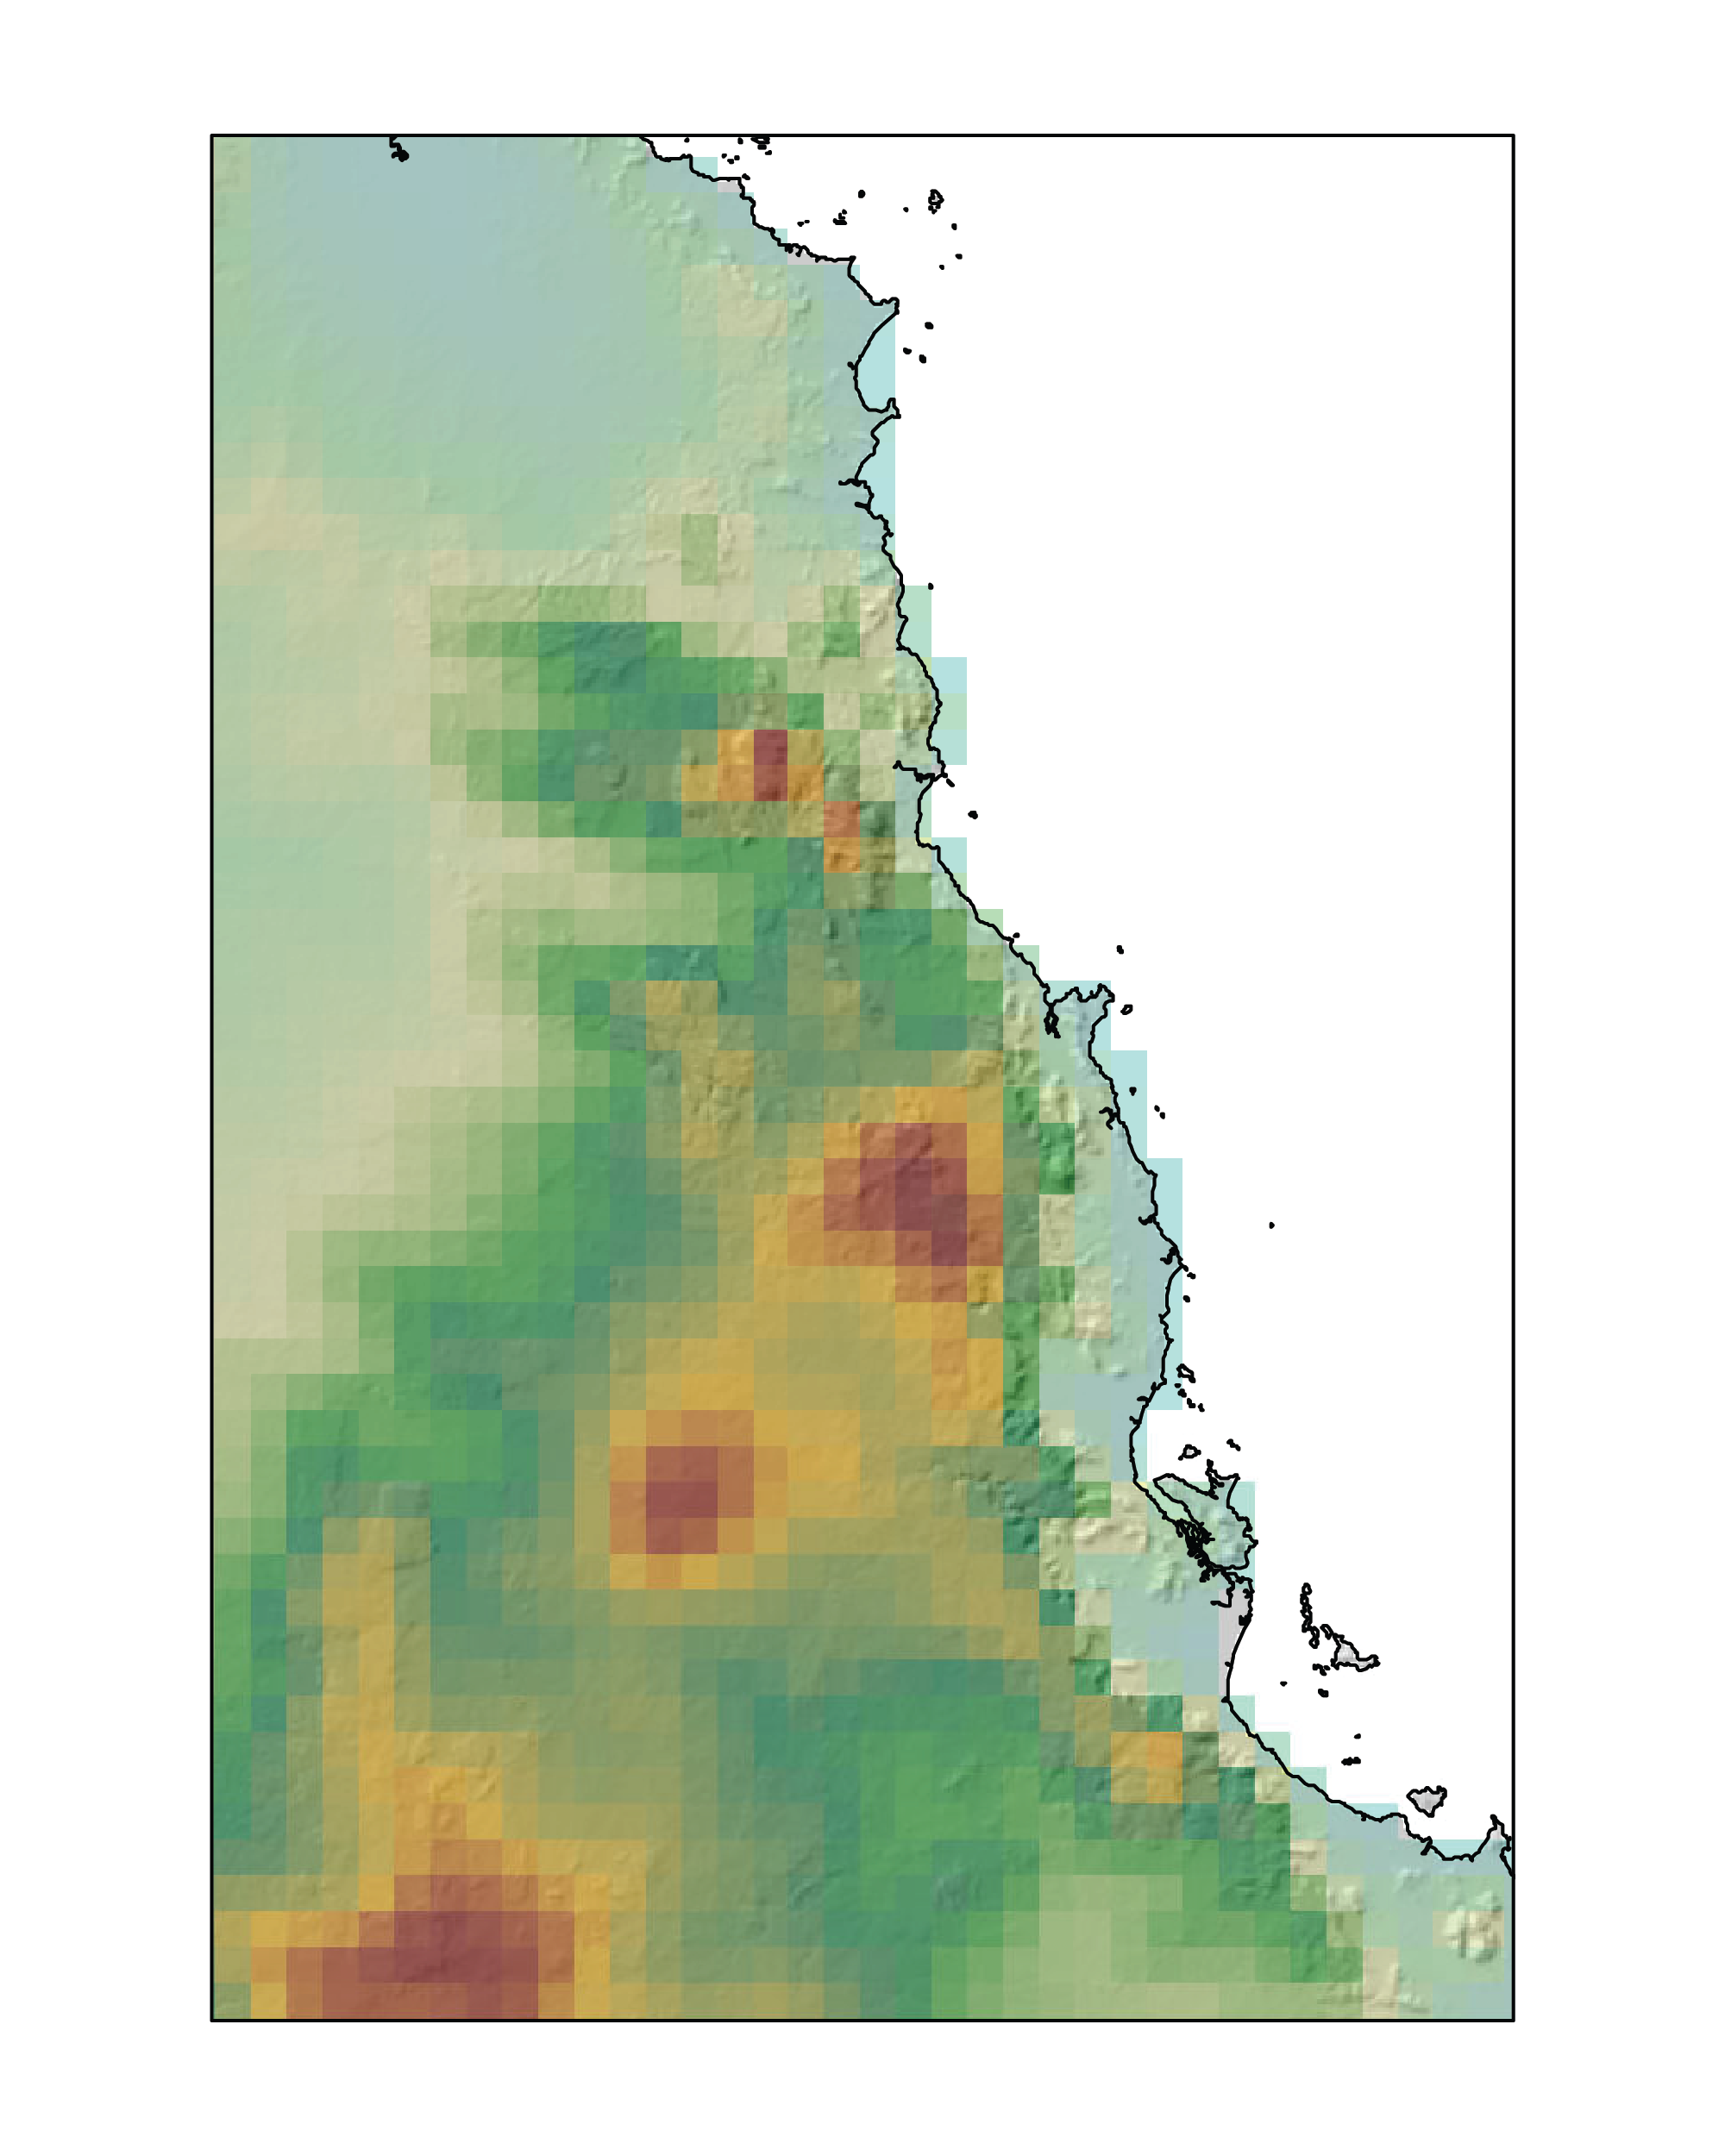
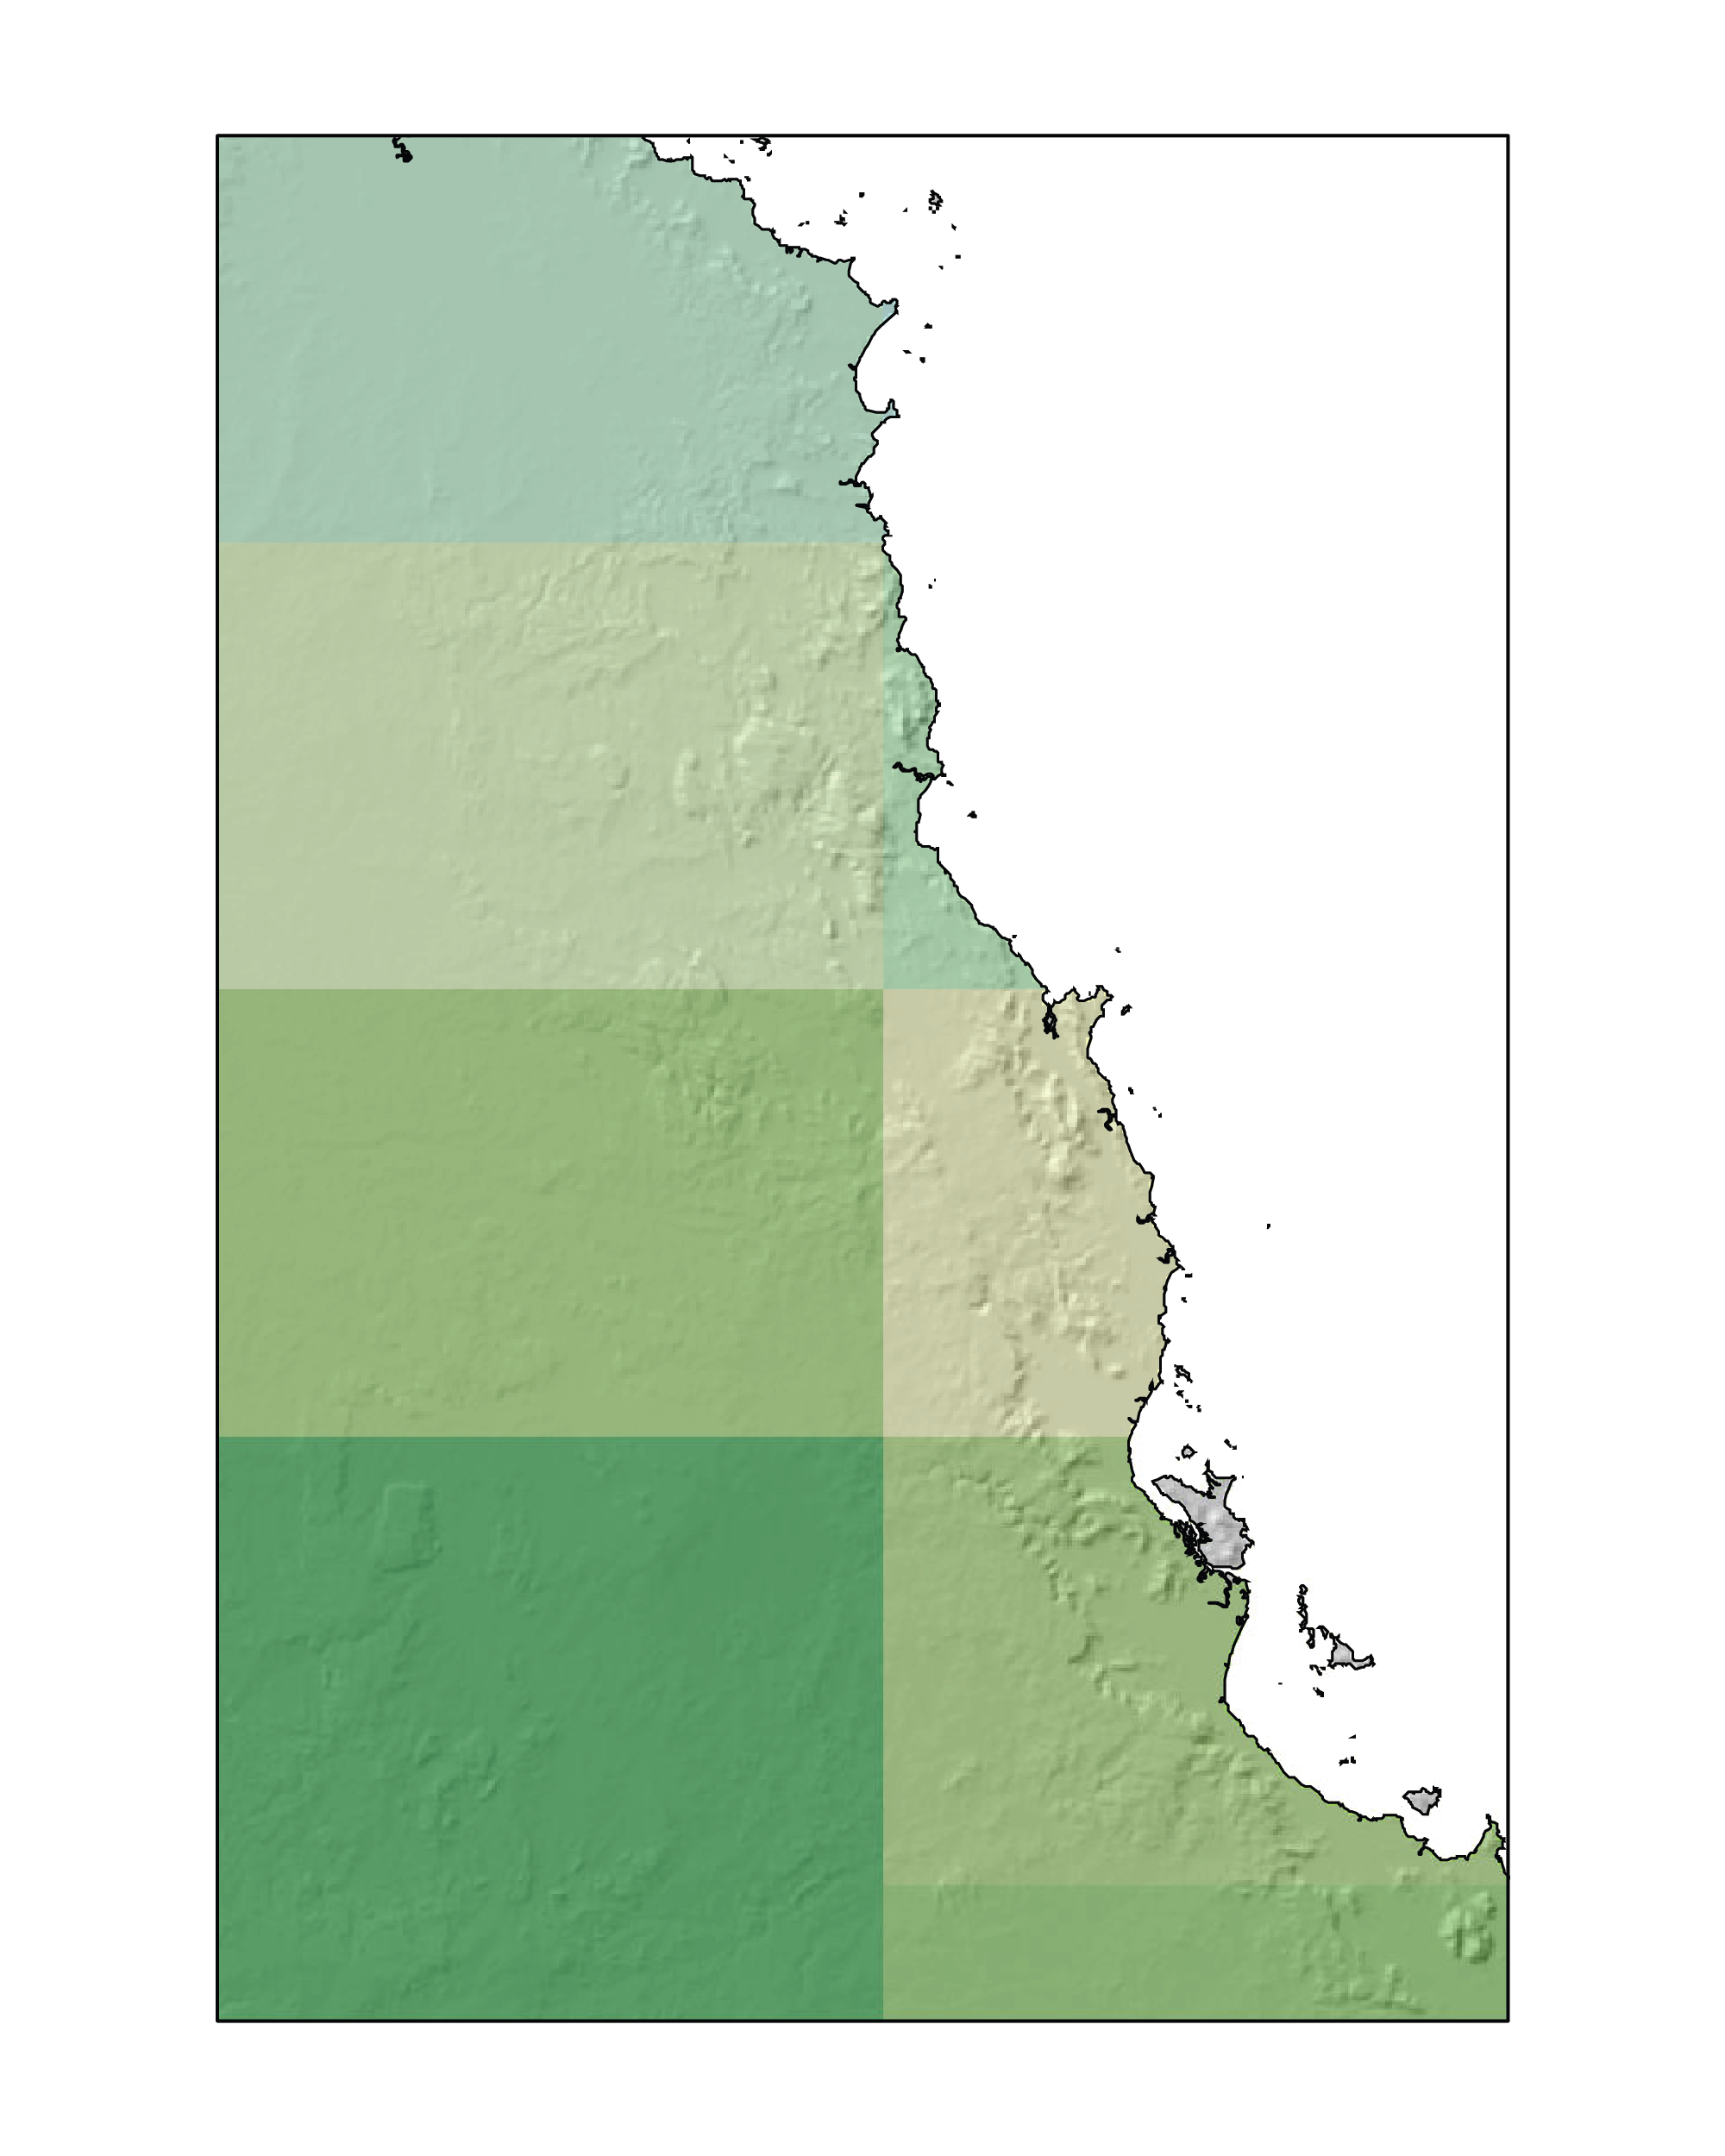
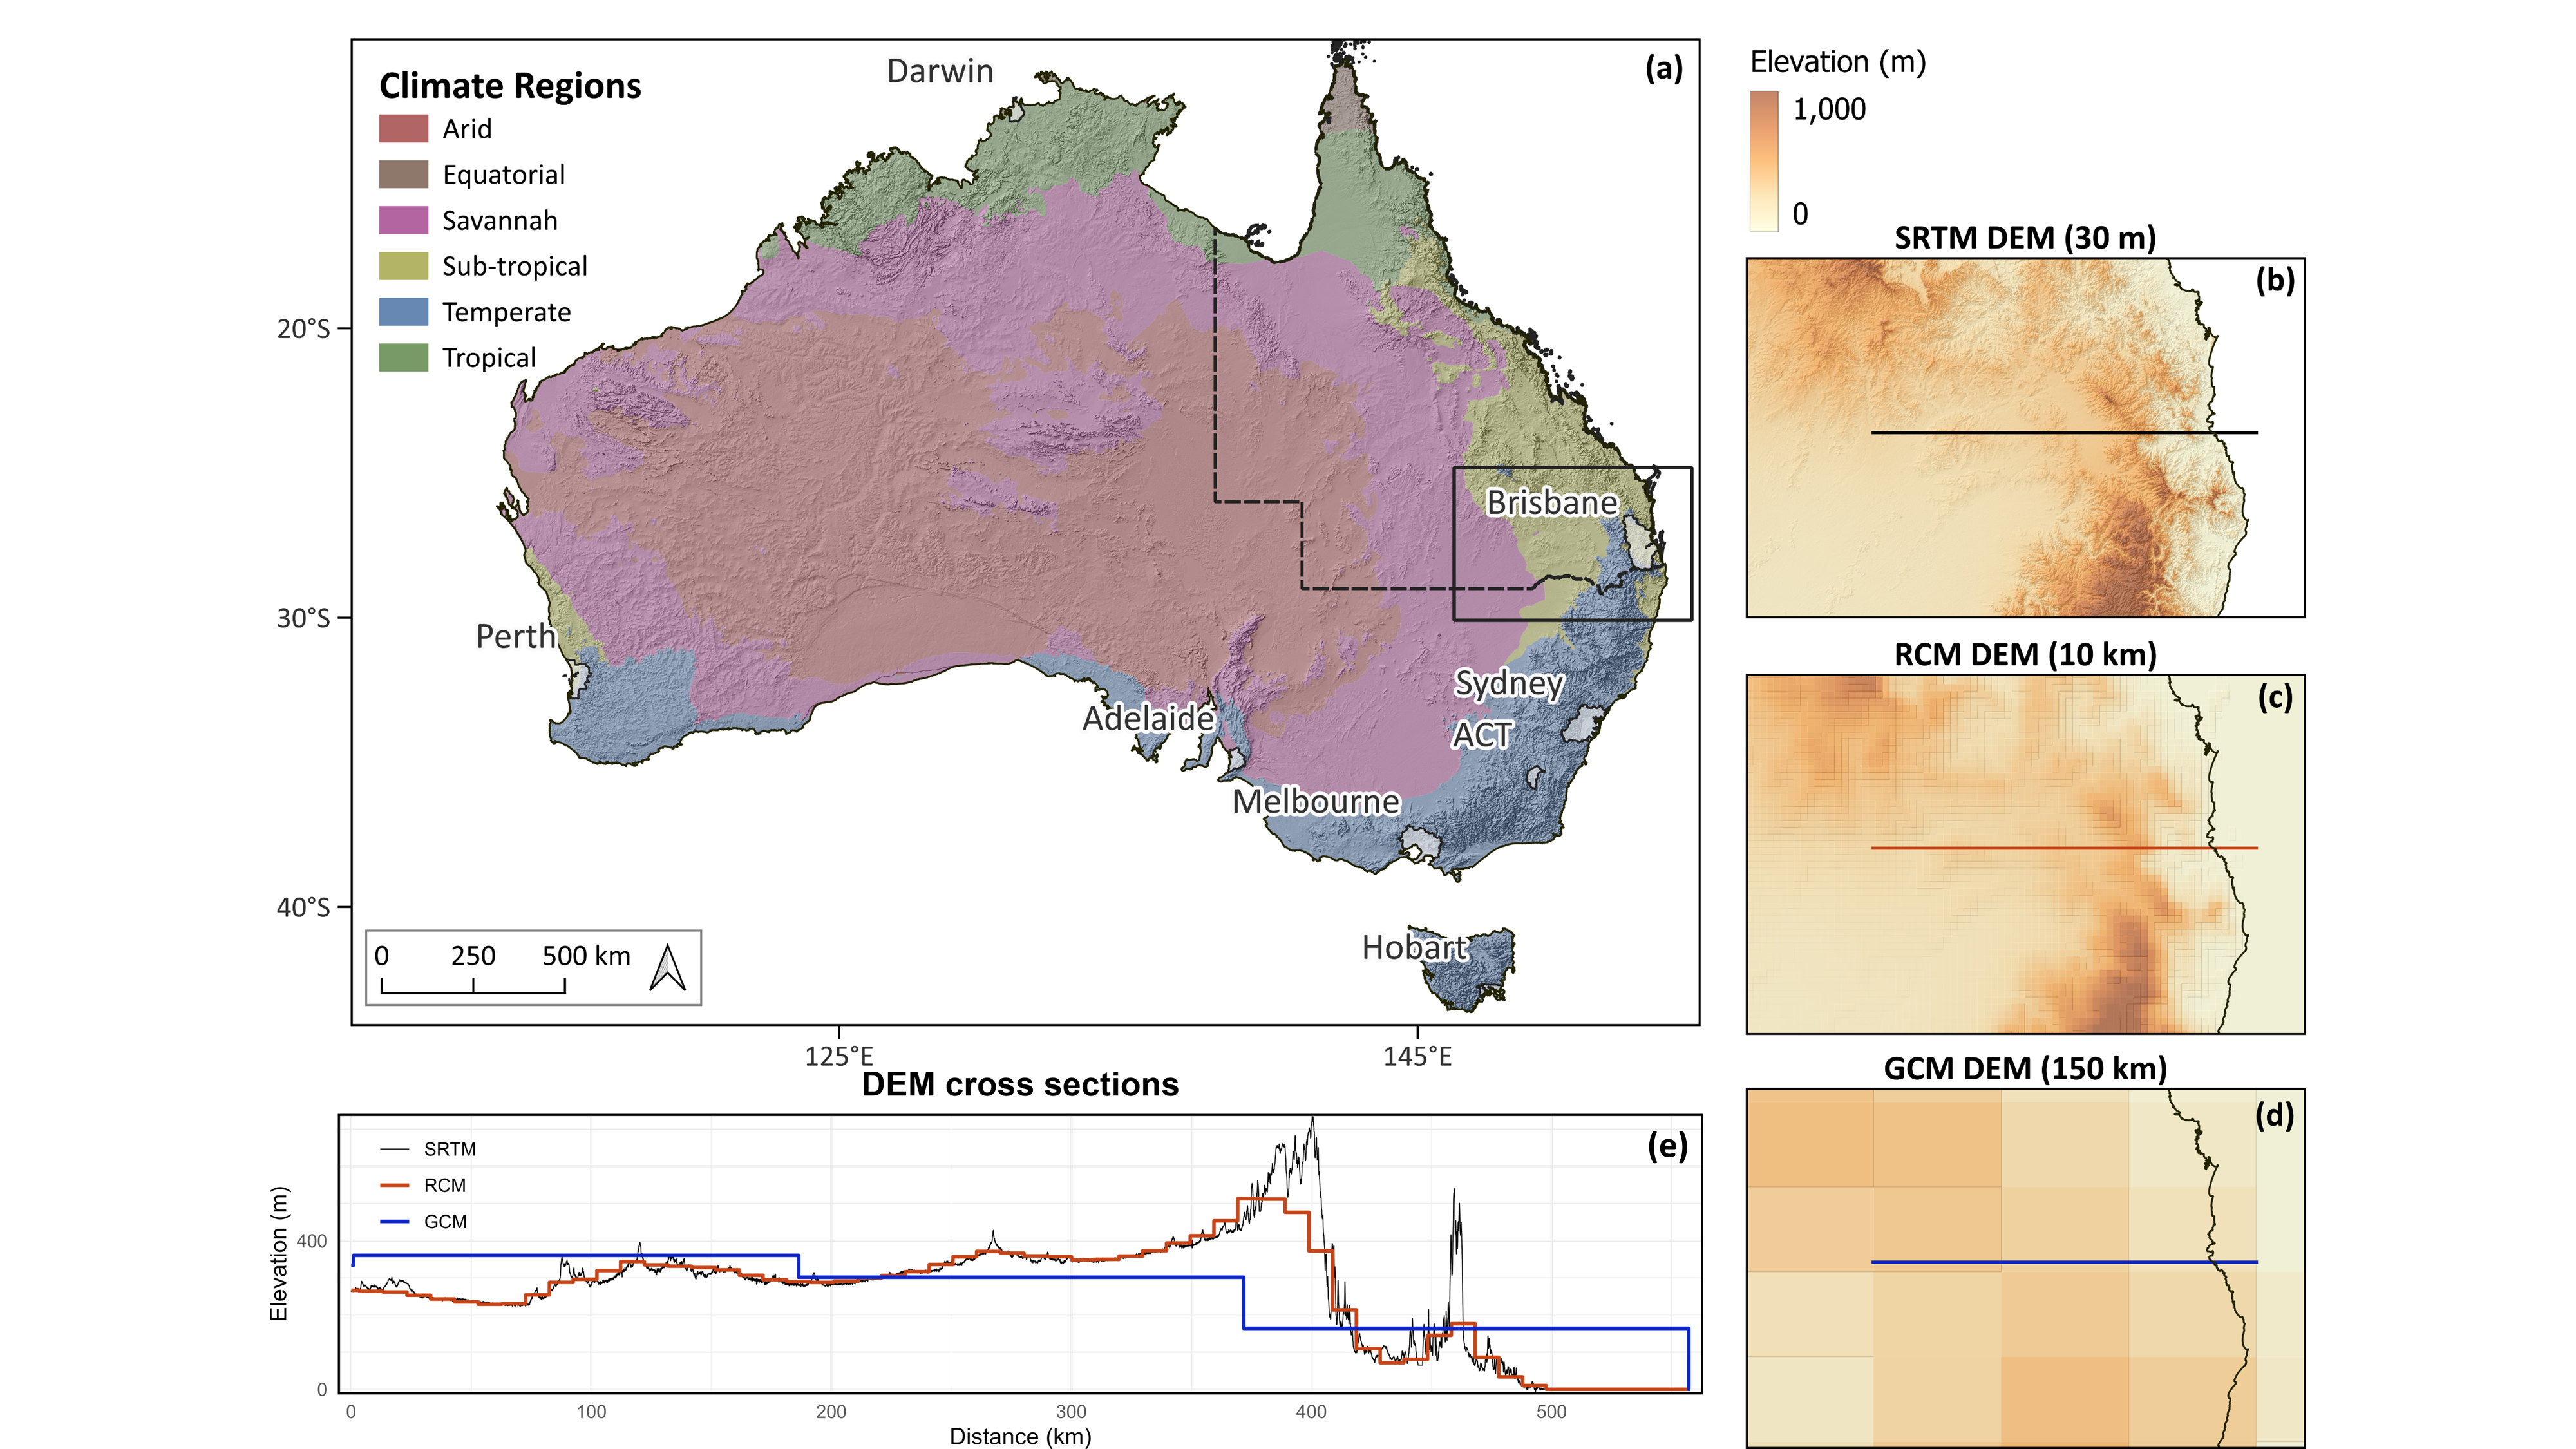
The figure below further demonstrates how regional climate models (RCMs) provide a more detailed representation of topography compared to global climate models (GCMs). It compares the resolution of ground surface elevation derived from Digital Elevation Models (DEMs) from the Shuttle Radar Topography Mission (SRTM), an RCM, and a GCM. A cross-sectional analysis of these DEMs across the Great Dividing Range highlights the superior ground surface elevation achieved by the RCM compared to the GCM.
Planning for an uncertain future
CMIP6 employs a new set of future emissions scenarios driven by a range of socioeconomic assumptions. These ‘Shared Socioeconomic Pathways’ (SSPs) incorporate plausible future changes to population, economic growth, education, urbanisation and technology development, and expand on the Representative Concentration Pathways used in earlier climate models.
The Queensland Future Climate Science Program has generated 45 Australia-wide simulations, with 15 simulations for three emissions scenarios ranging from low to high emissions. These sets of projections are called ensembles. The ensembles reveal the more likely future climate conditions as well as some of the less likely, but high-impact possibilities. An example of a high-impact climate future is significant warming coupled with low rainfall.
The Queensland Future Climate Science Program delivers projections for three SSPs, representing different future greenhouse gas concentrations and successively greater climate change impacts (the number associated with each SSP indicates the resulting level of 'climate forcing' at 2100, with a larger number meaning more warming):
SSP1-2.6
Sustainability
A more sustainable, equitable and inclusive world, coupled with an optimistic scenario where global greenhouse gas emissions are cut aggressively to net zero by about 2050. This scenario aligns with temperatures rising by about 2°C by 2100.
SSP2-4.5
Middle of the road
Social, economic, and technological trends similar to the past. Emissions remain steady before starting to fall in the middle of the century. Net zero is not reached by 2100, with temperatures rising by about 2.7°C by then.
SSP3-7.0
Regional rivalry
Limited international environmental efforts. Emissions continue to rise, with temperatures rising by about 3.6°C by 2100.
Climate Scenario Guide Click on the categories below to highlight related data across all scenarios and see the informative images below. You can also hover over specific elements within the scenario boxes to view detailed descriptions relating to each category.
SSP1-2.6
- Low
- 440ppm
- 1.3 - 2.4°C
- 32 - 62cm
SSP2-4.5
- Moderate
- 600ppm
- 2.1 - 3.5°C
- 44 - 76cm
SSP3-7.0
- High
- 870ppm
- 2.8 - 4.6°C
- 55 - 90cm
SSP5-8.5
- Very High
- 1130ppm
- 3.3 - 5.7°C
- 63 - 101cm
Source:
Assessing simulations of Queensland’s climate
Researchers at the Queensland Government assessed how well the downscaled CMIP6 GCM simulations and host GCM simulations compared with observational data from the Australian Gridded Climate Dataset provided by the Bureau of Meteorology.
Downscaled simulations yielded marked improvements over the GCM simulations of Australia’s climate. The more detailed topography, sea-land contrasts and land cover in the downscaled models improved the simulation of the annual cycles of temperature and precipitation, as well as the number of dry days, extreme precipitation and extreme minimum temperatures. Particularly dramatic were the improvements in the downscaled simulations of minimum temperatures.
Importantly, downscaling improved the simulation of climate variables, such as extreme precipitation, typically used in assessments of climate change impacts. Hydrological impact studies, including assessing the likely impacts of climate change on flooding and soil erosion, will benefit from the improvements.
Downscaled improvements to climate projections in mountainous and coastal areas are noteworthy; these regions are home to much of Queensland’s population. In fact, the largest model improvements occurred in the densely populated south-east of the state, with large improvements in the simulation of both temperature and precipitation.
Global climate models alone have limited skill in reproducing regional climate.
This is the skill score for the South East Queensland Regional Planning area using global models.
There are significant improvements from downscaling the global models.
Downscaling improved the simulation of climate in each of the state’s 12 regions.
Greatest improvements from downscaling come in the populated south-east.
Well prepared for the future
Climate change is likely to have significant impacts on human-created and natural systems. High-resolution climate change projections can be used to evaluate local and regional climate change impacts. The below figure shows timeseries of downscaled mean annual temperature projections averaged for all of Australia for the three SSP emission scenarios. Each solid line represents the average of a 15 model ensemble with the shaded bands around each line representing the model variability.
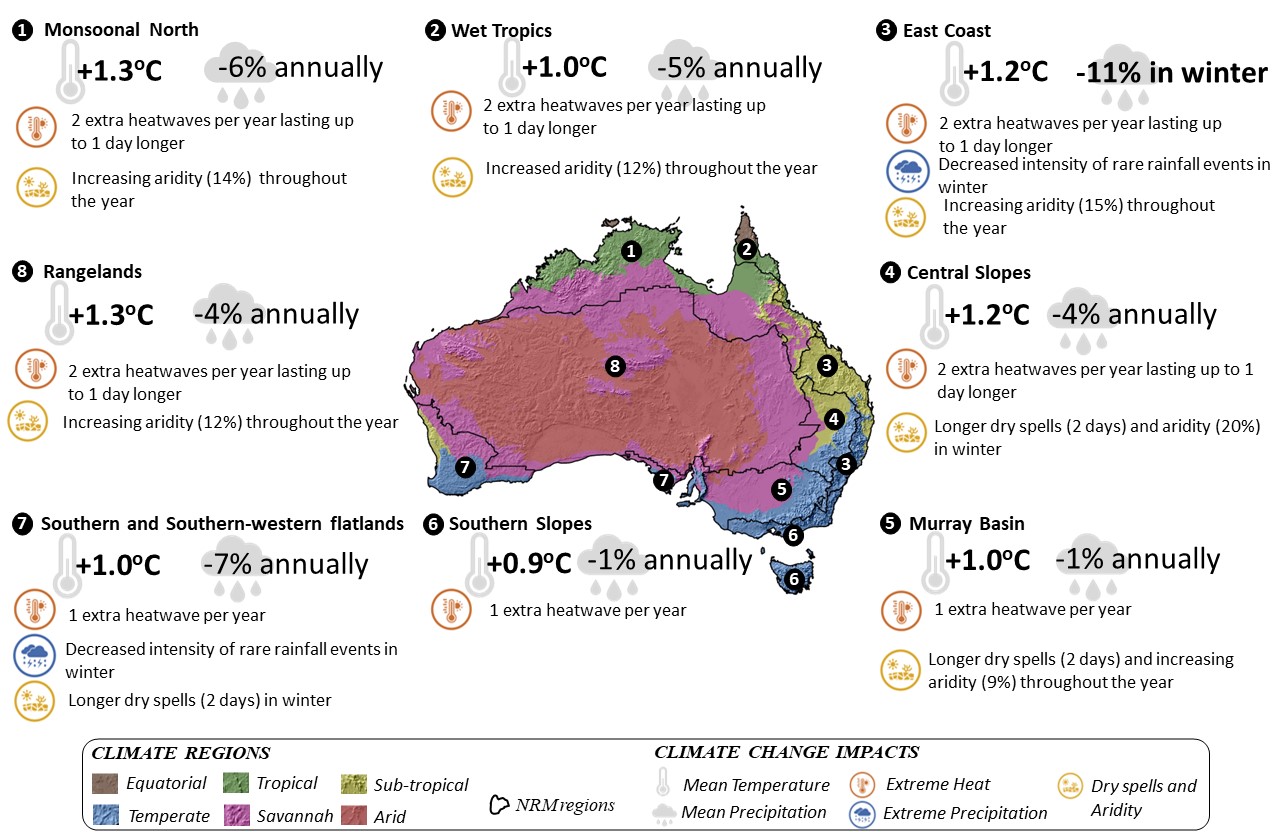
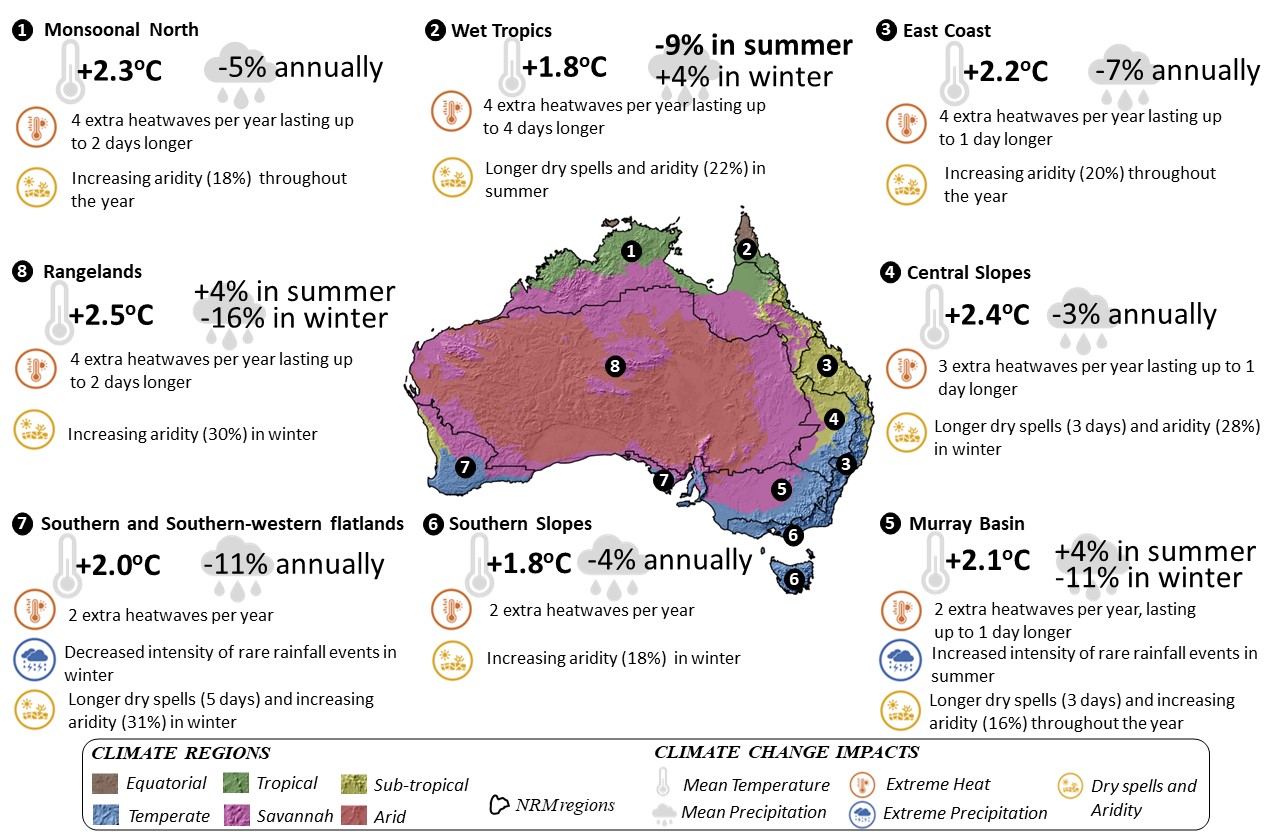
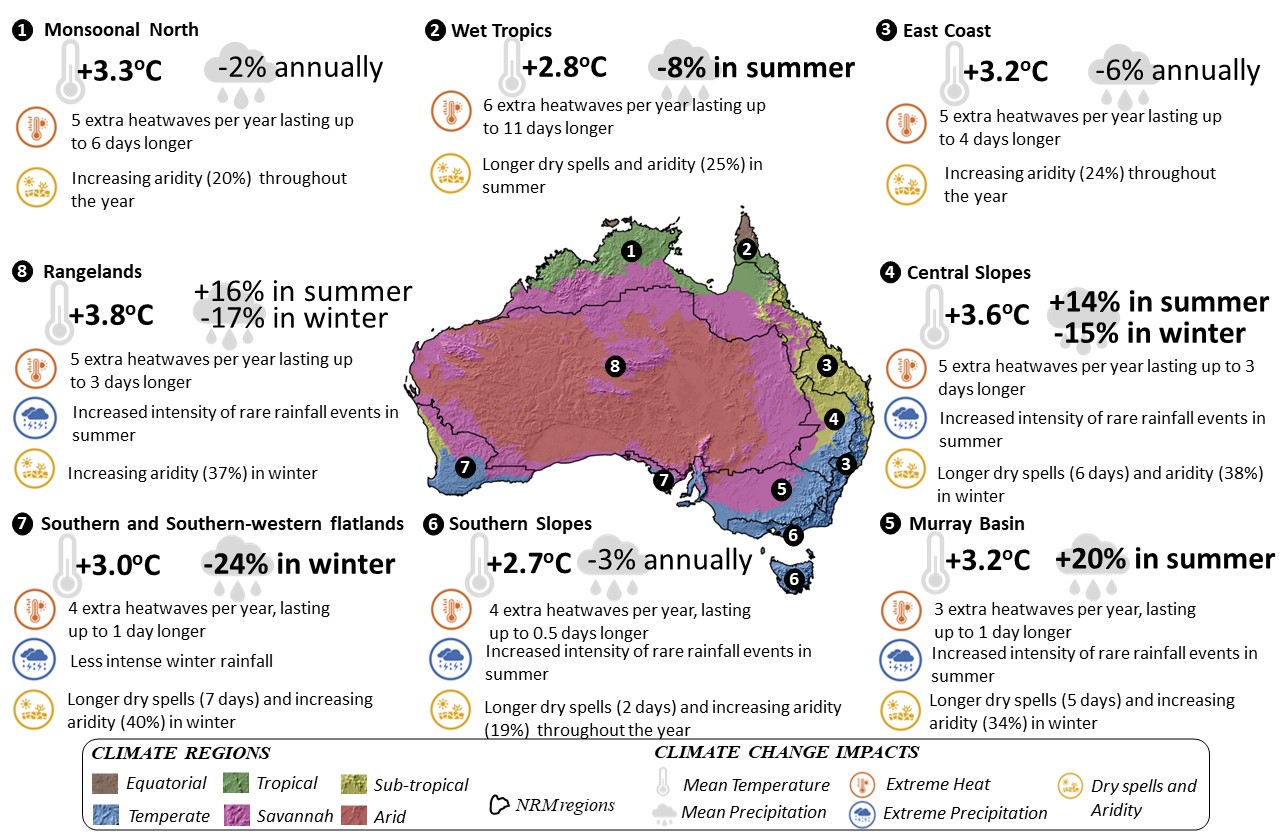
Interactive Timeseries Figure: Click on the individual emissions scenarios to display an infographic that summarises key climate hazard information for the eight Natural Resource Management areas in Australia.
This InfoGraphic shows summarised hazard information under SSP1-2.6 for the 2080-2100 timeslice
This InfoGraphic shows summarised hazard information under SSP2-4.5 for the 2080-2100 timeslice
This InfoGraphic shows summarised hazard information under SSP3-7.0 for the 2080-2100 timeslice.
Decision makers, policymakers, risk managers and engineers need climate information that tracks key trends and the exceedance of thresholds that challenge human and natural systems. The required climate information can vary widely between sectors.
The Queensland Future Climate Science Program employs international best practice to deliver data and information on the likely changes that will affect the state, delivering a large number of climate variables and hazard metrics relevant to many sectors and specific information for each region. These climate change projections support decision-making in an uncertain environment, by informing a range of processes, such as conducting climate change risk assessments and developing adaptation strategies. A climate change risk assessment incorporates projections of the likely climatic changes, together with information on the exposure and vulnerability of exposure to the changes and the anticipated impacts. See the following two links for further guidance on climate risk assessments:
- Coast Adapt: How to conduct a climate change risk assessment
- Climate Compass: A climate risk management tool for organisations dealing with climate change risks
