Rainfall and Pasture Growth Maps
Access the rainfall and pasture growth maps
What is included in rainfall and pasture growth maps?
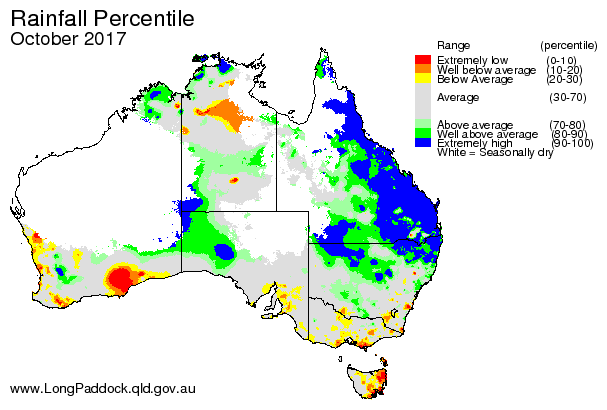
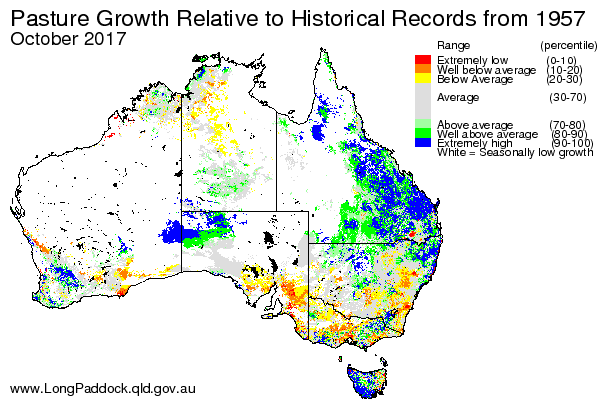
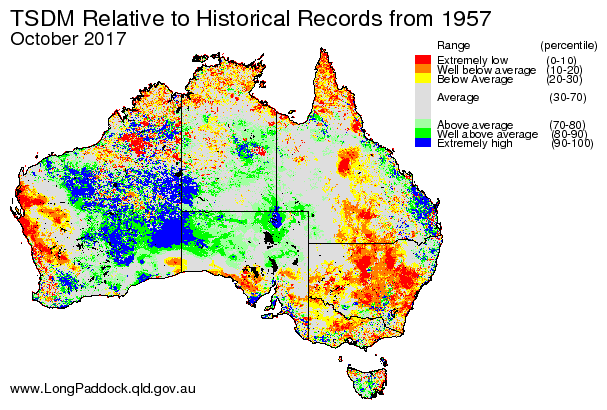
The rainfall maps on this site are produced from raw data from the Bureau of Meteorology using grid interpolation techniques from the SILO (Jeffrey et al. 2001). Rainfall and rainfall percentile maps give an indication of pasture production. However, the effectiveness of total rainfall over a particular period depends upon previous seasonal conditions, within seasonal rainfall distribution, rainfall intensity, temperatures, soil and pasture types, grazing pressures and time of year. Using the AussieGRASS model, a series of maps showing simulated pasture growth and associated products can provide a more accurate picture of seasonal conditions.
The following information is available through the Rainfall and Pasture Growth Maps area, as GIF, PDF and IMG files:
Maps files
- Monthly rainfall and pasture (growth, biomass, curing index and grass fire risk)
- Rainfall and pasture growth percentiles (1, 3, 6, 12, 24 and 36 months)
- Pasture biomass percentiles (1 month)
- Seasonal pasture growth 3-month outlook (probability) and skill score
- Potential flow to stream (runoff) percentiles (1, 3, 6, 12, 24 and 36 months)
- Potential flow to stream (runoff) outlook
- Forecast curing and ground cover anomalies (3-month outlook (probability))


Sample maps as GIF or PDF files
ERDAS Image data files
Data available as ERDAS Imagine (.img) files can be imported into GIS software such as Arc Info or converted to other formats using public domain software such as GDAL translate. The GIS files can then be used to generate enhanced map products and carry out statistical analysis. They are available for most of the AussieGRASS products. The archive of rainfall maps begins in January 1890. Historical pasture related maps extend back to at least 2000.
Other information
The following products may also be available on application:
- Access to daily estimates of fuel load via FTP
- Experimental products and customised analyses
